At Tinyclues, we think a lot about how to measure the success of CRM initiatives. We speak with our customers on a daily basis to better understand their goals and the challenges they face. CRM Marketing is a crucial function, bringing value to the entire customer lifecycle – and it can become a powerful source of revenue for businesses.
In thinking about how to measure the impact of CRM – and its impact on companies’ revenue streams in particular – we’ve developed a set of CRM KPIs helpful for companies no matter the maturity of their CRM practices. We’re super excited to be sharing this table with you, and we hope it proves useful in both the short- and long-term. So buckle up! It’s time to take a closer look at our Table of KPIs!
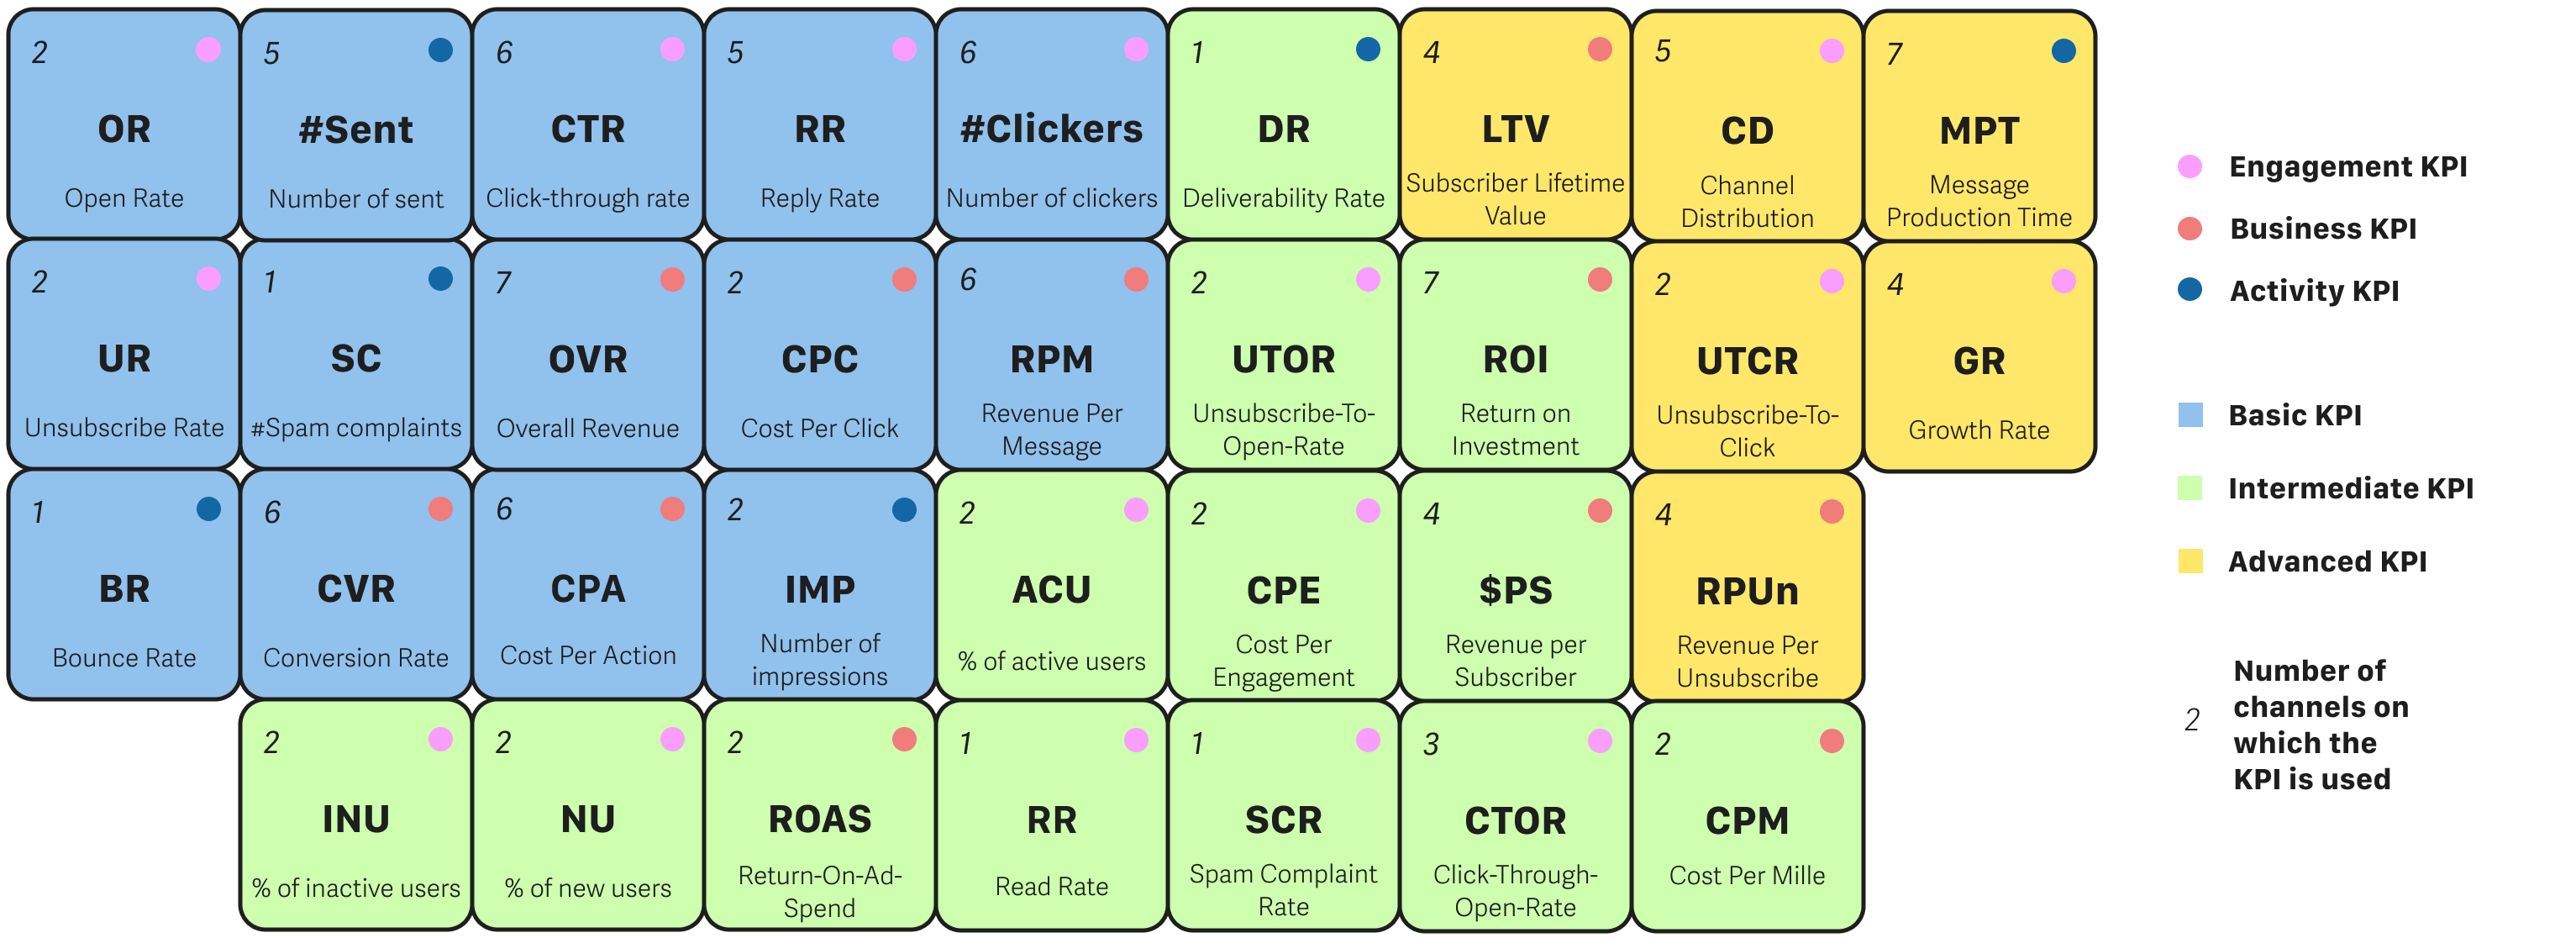
How to read and use the table?
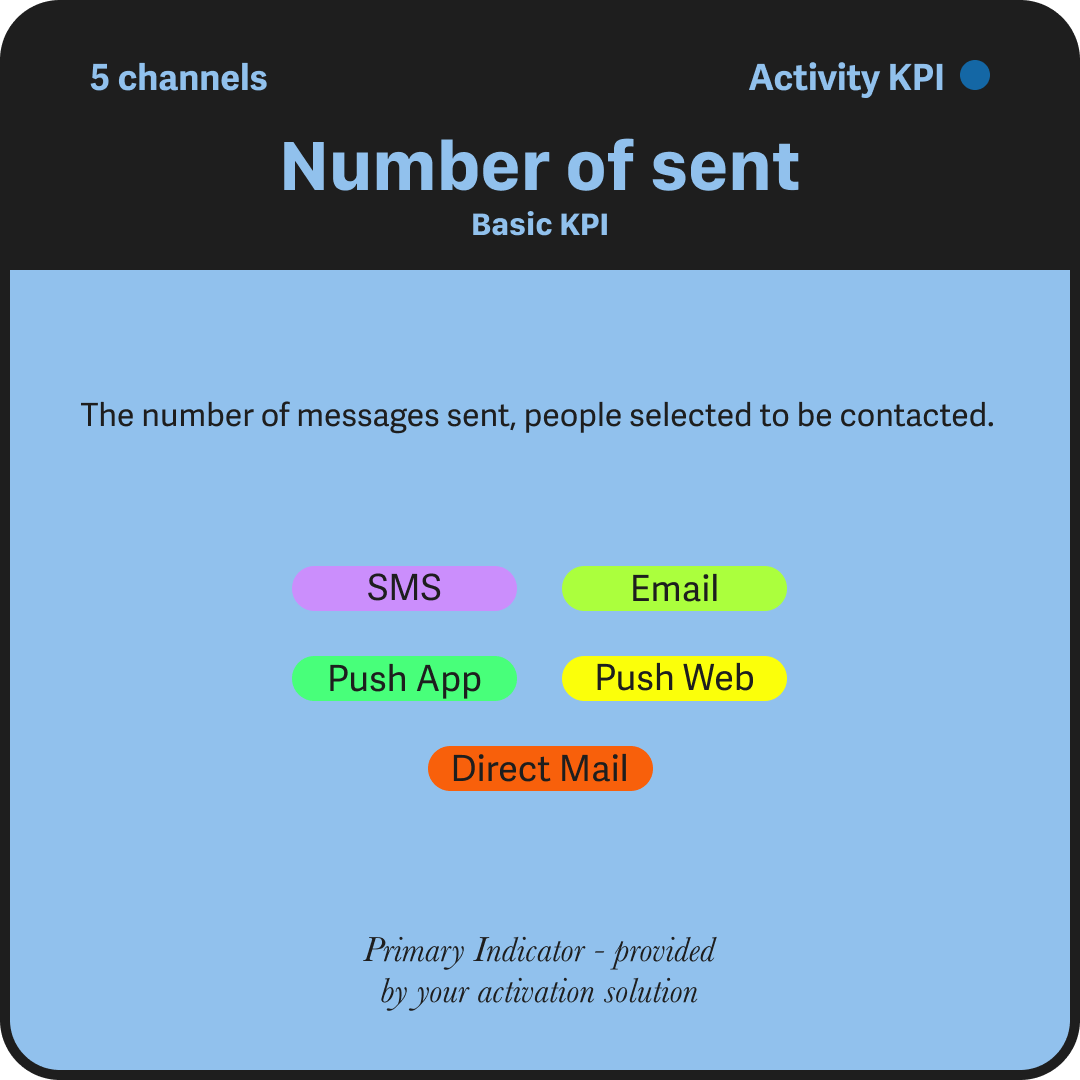
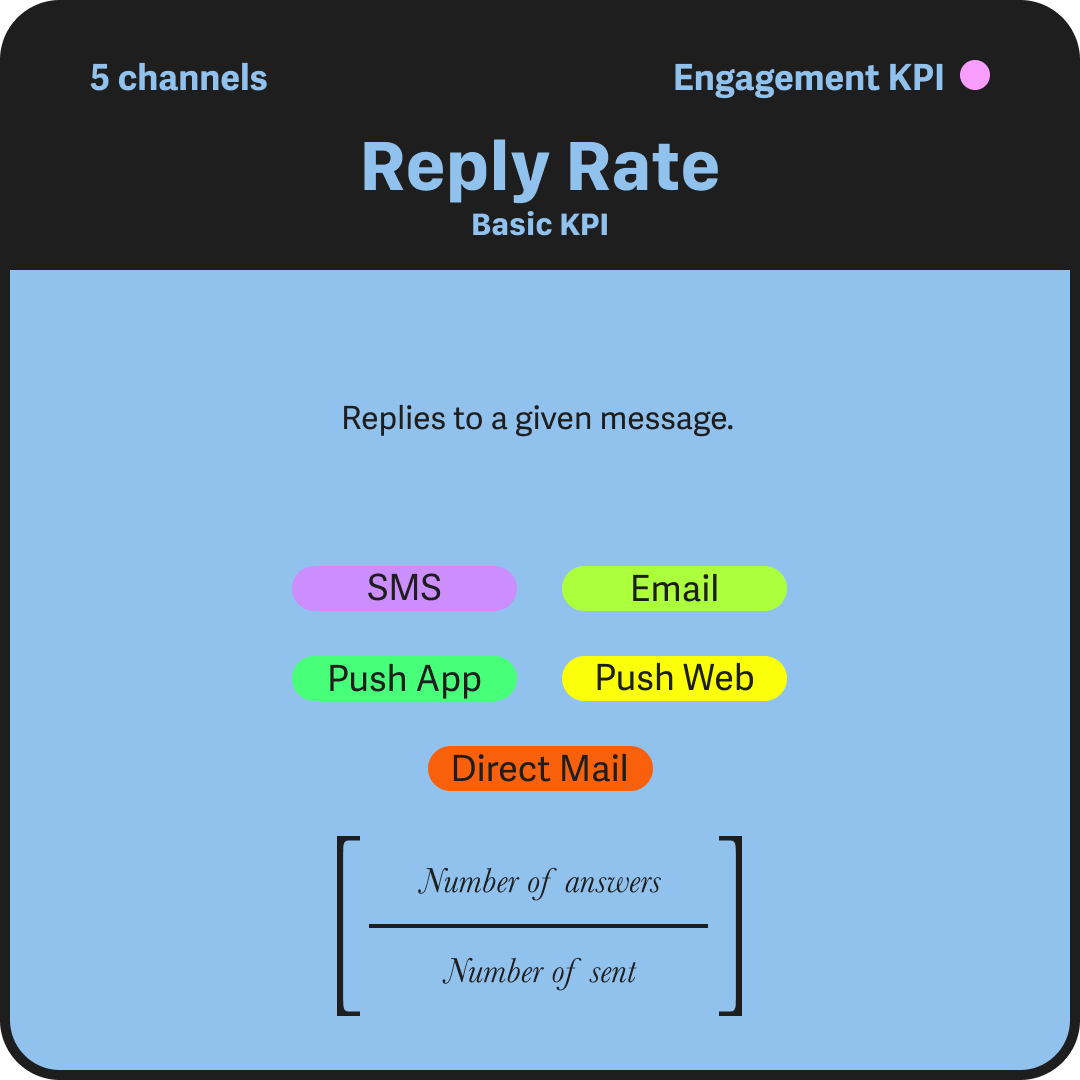
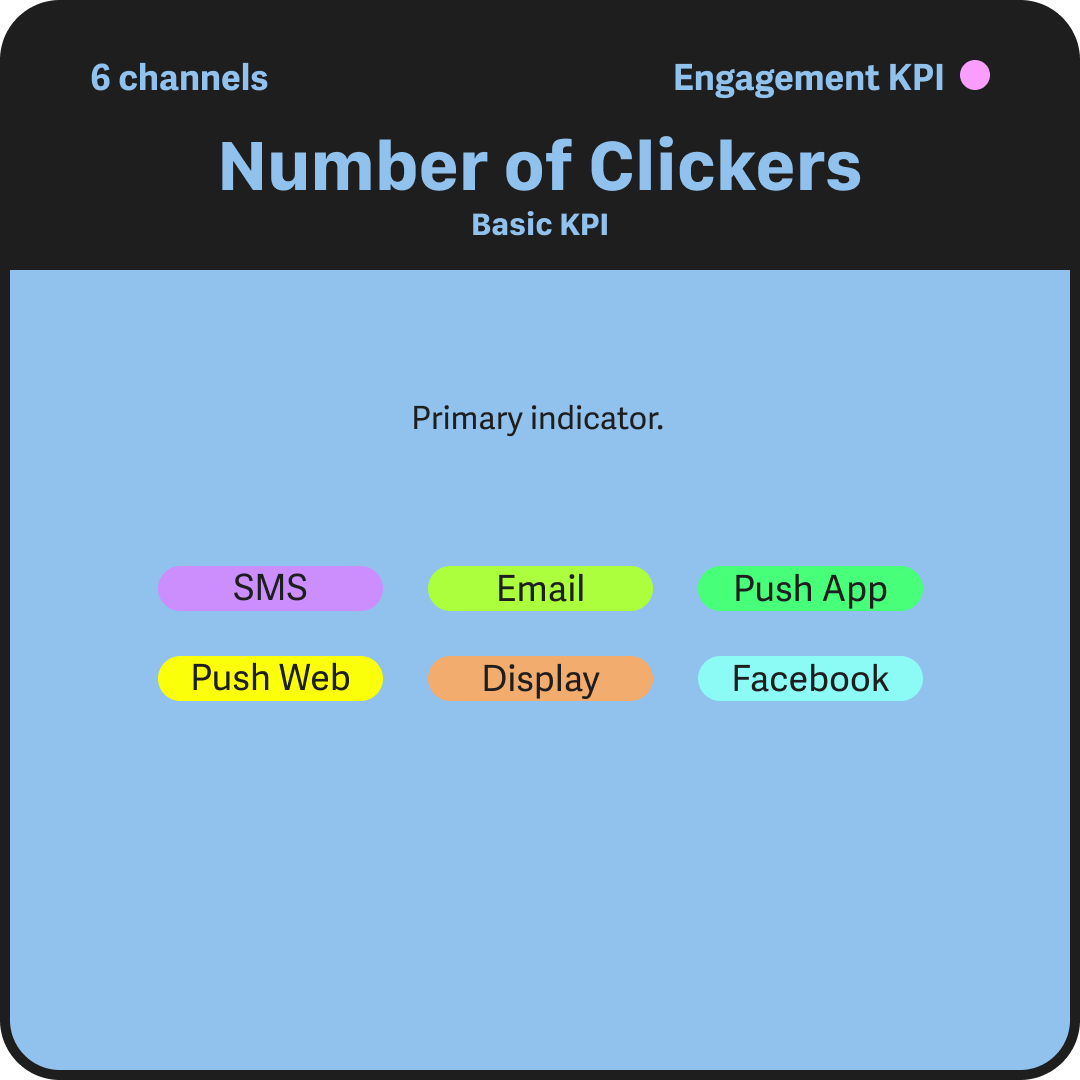
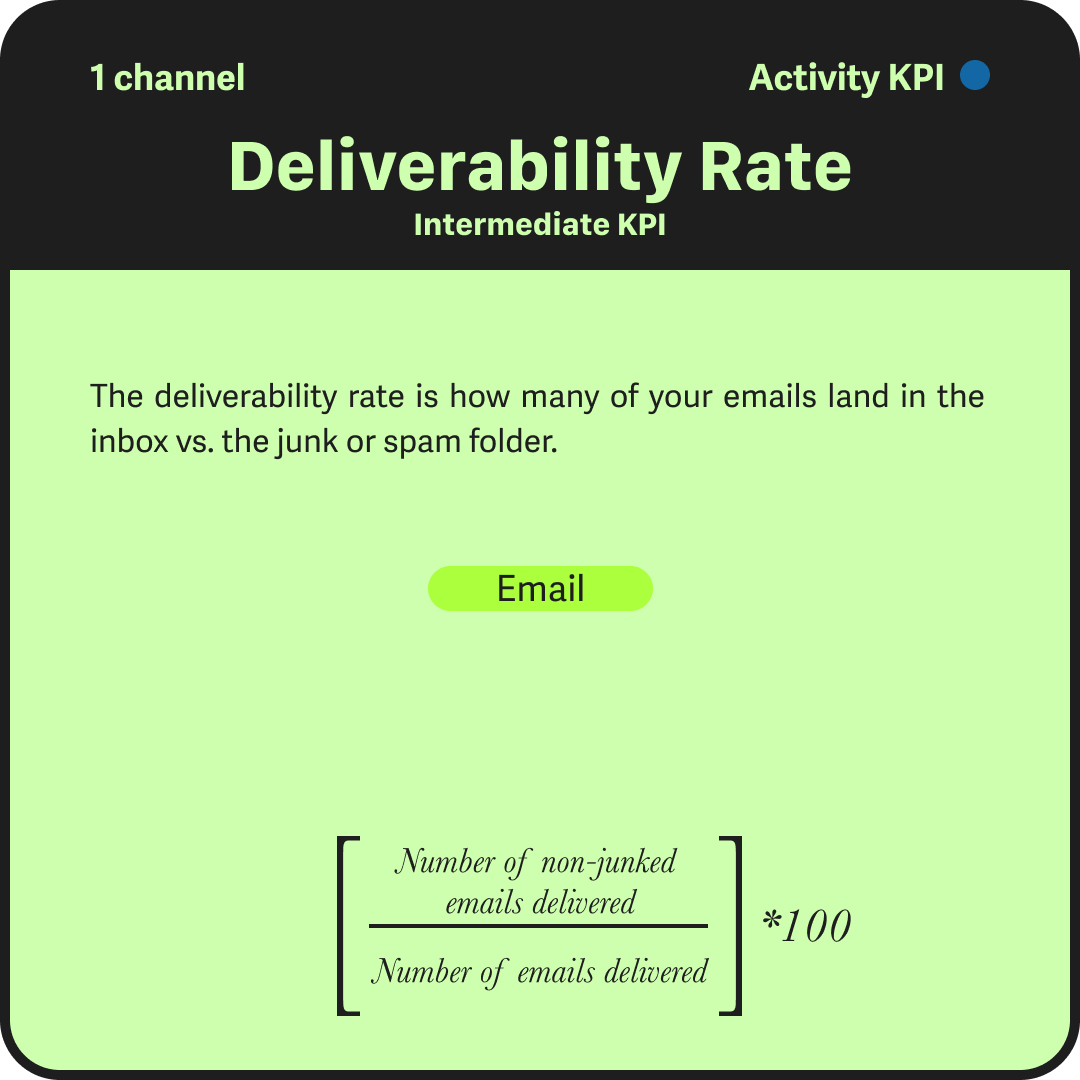
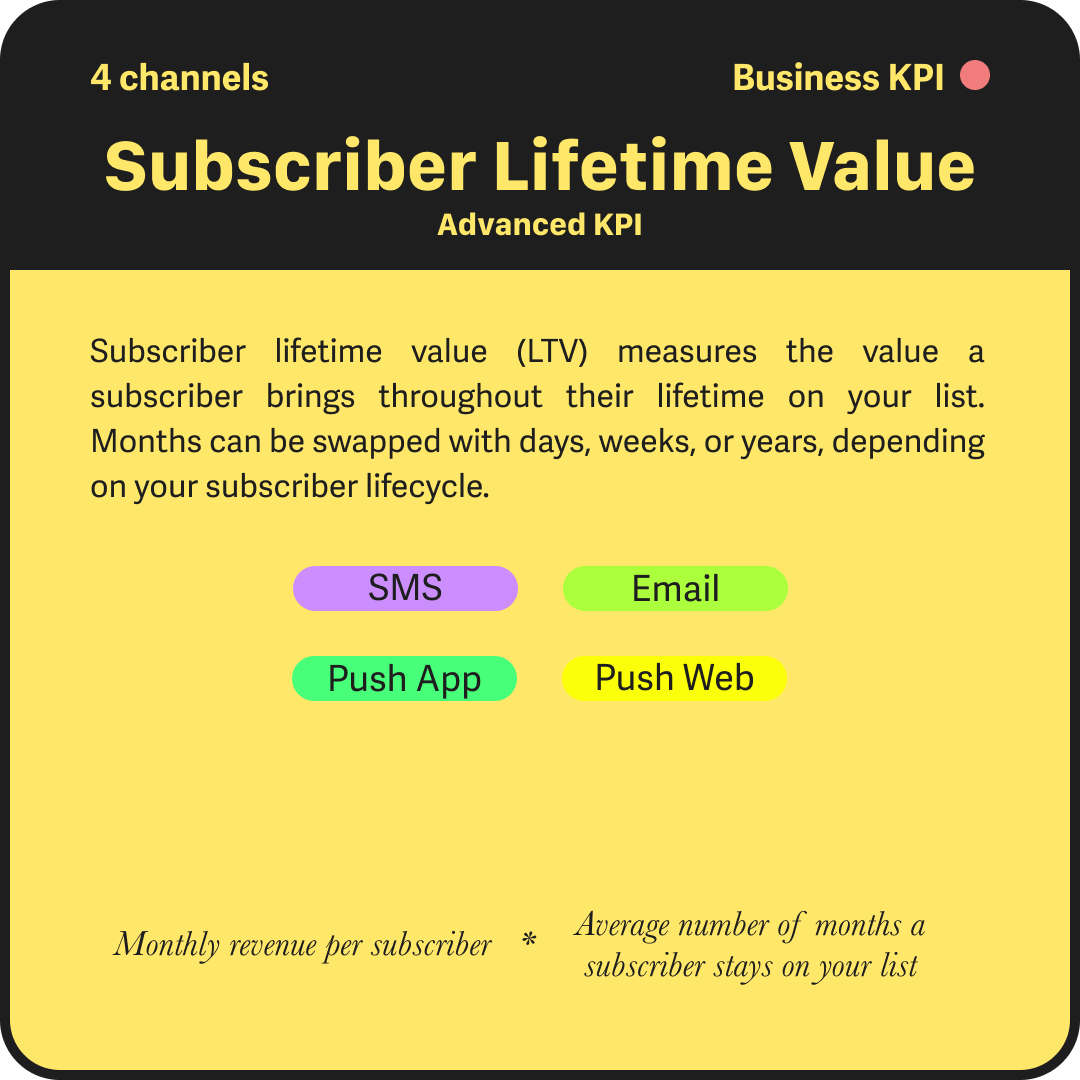
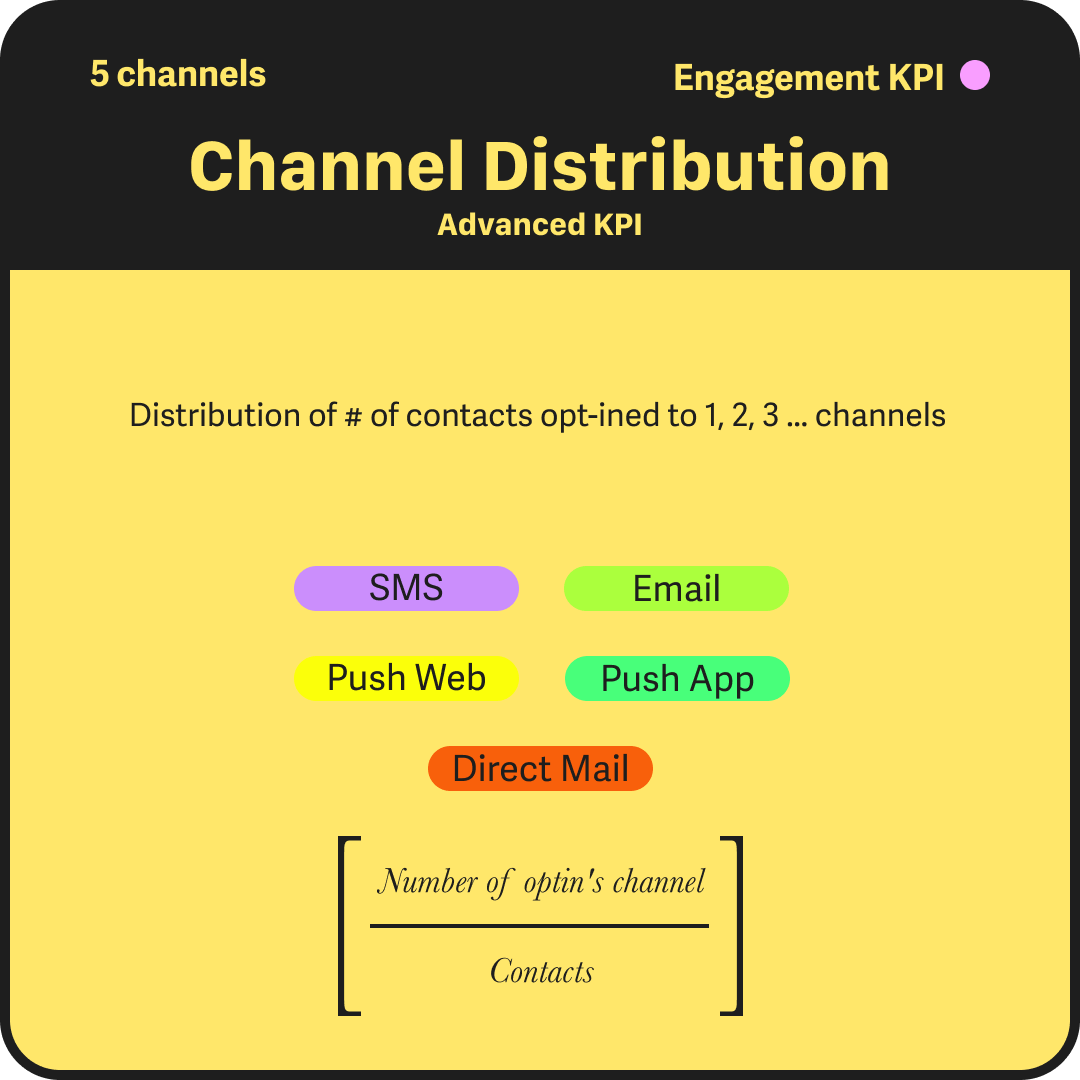
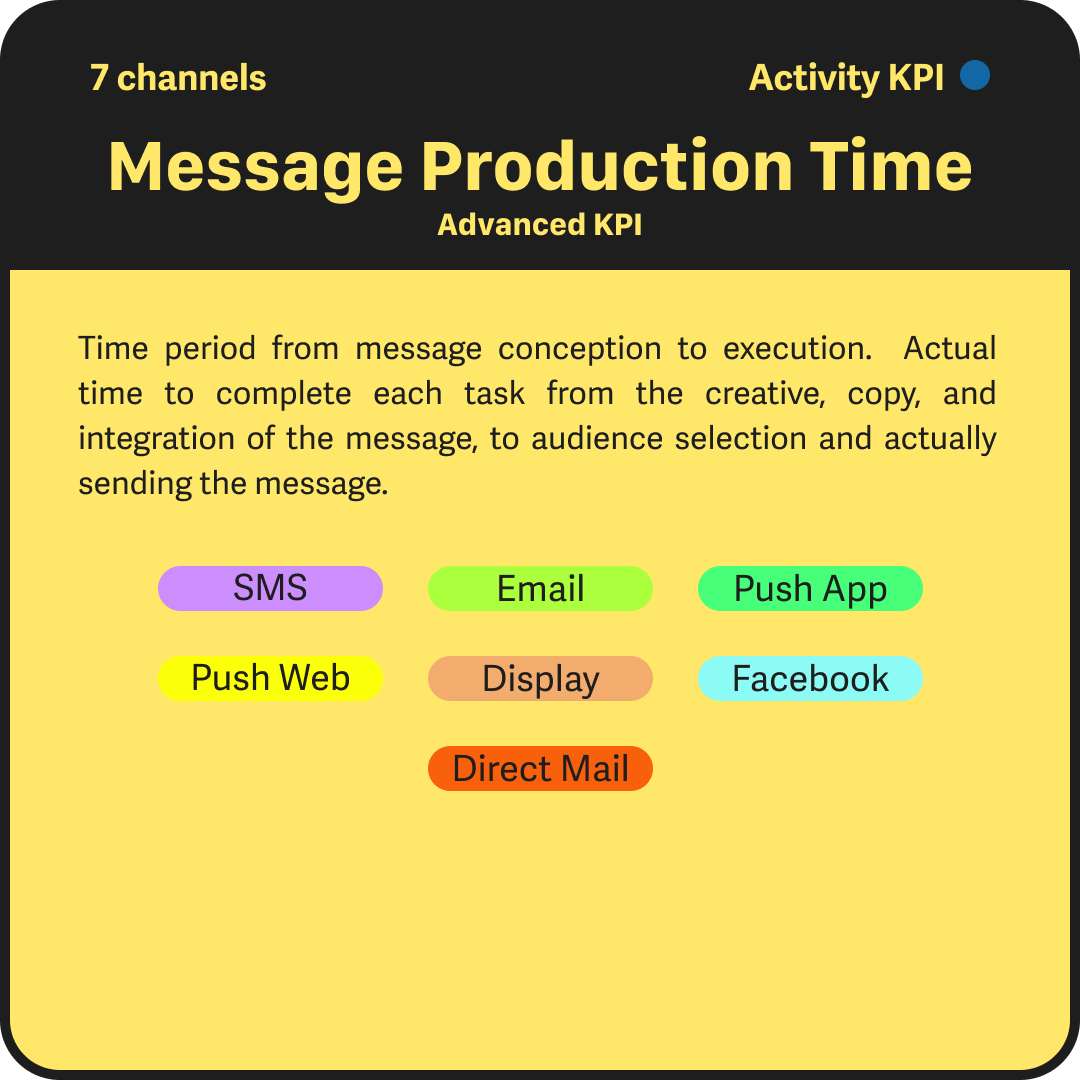
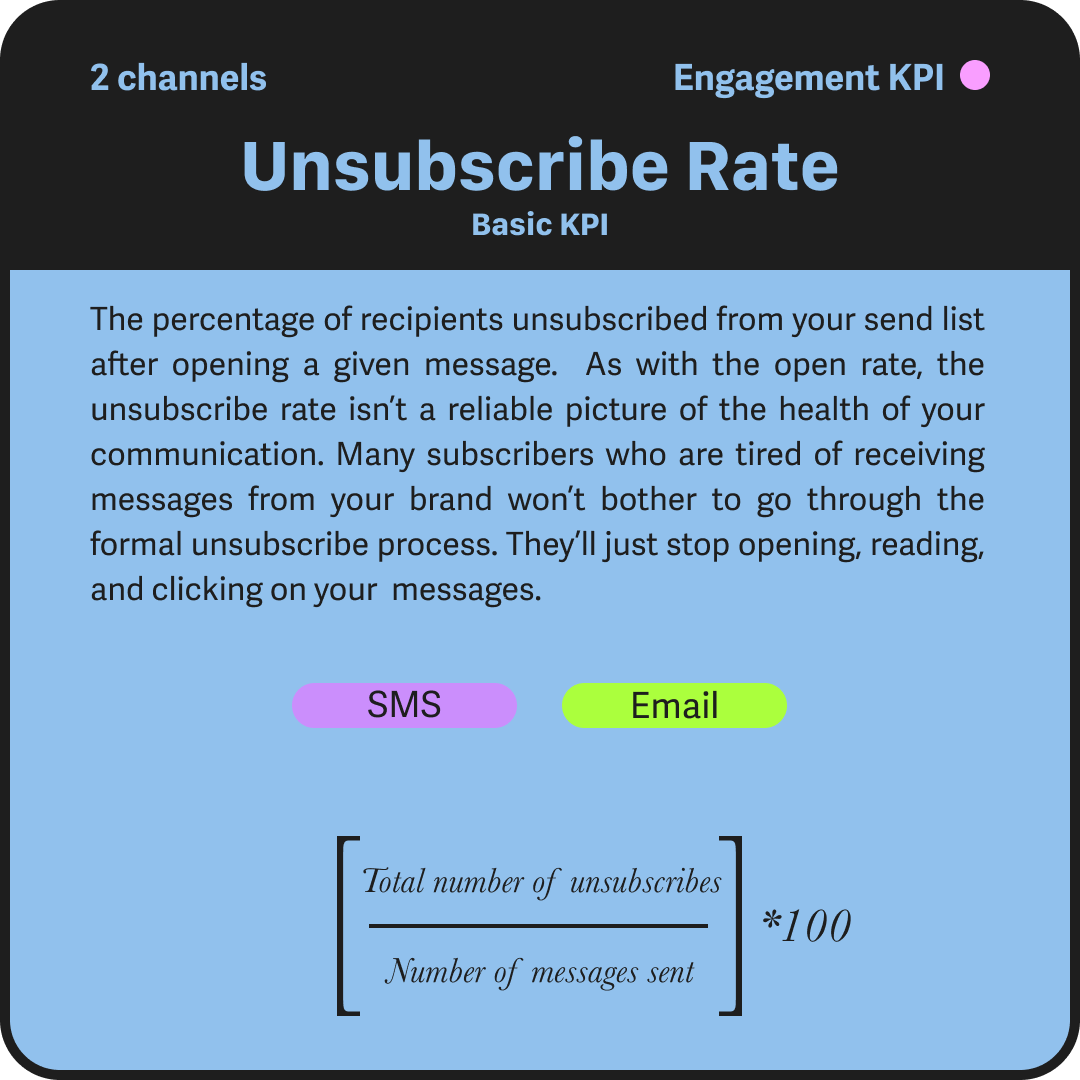
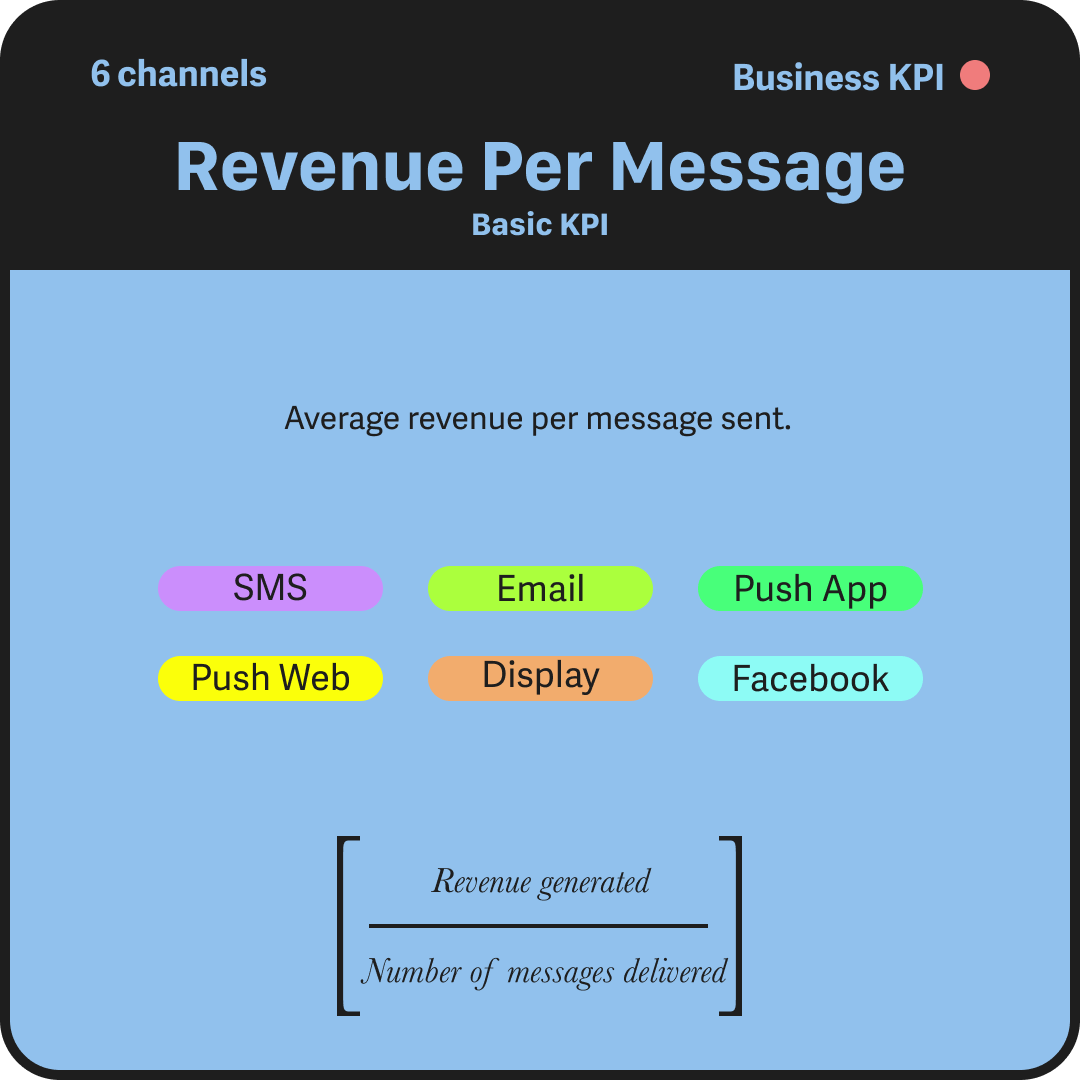
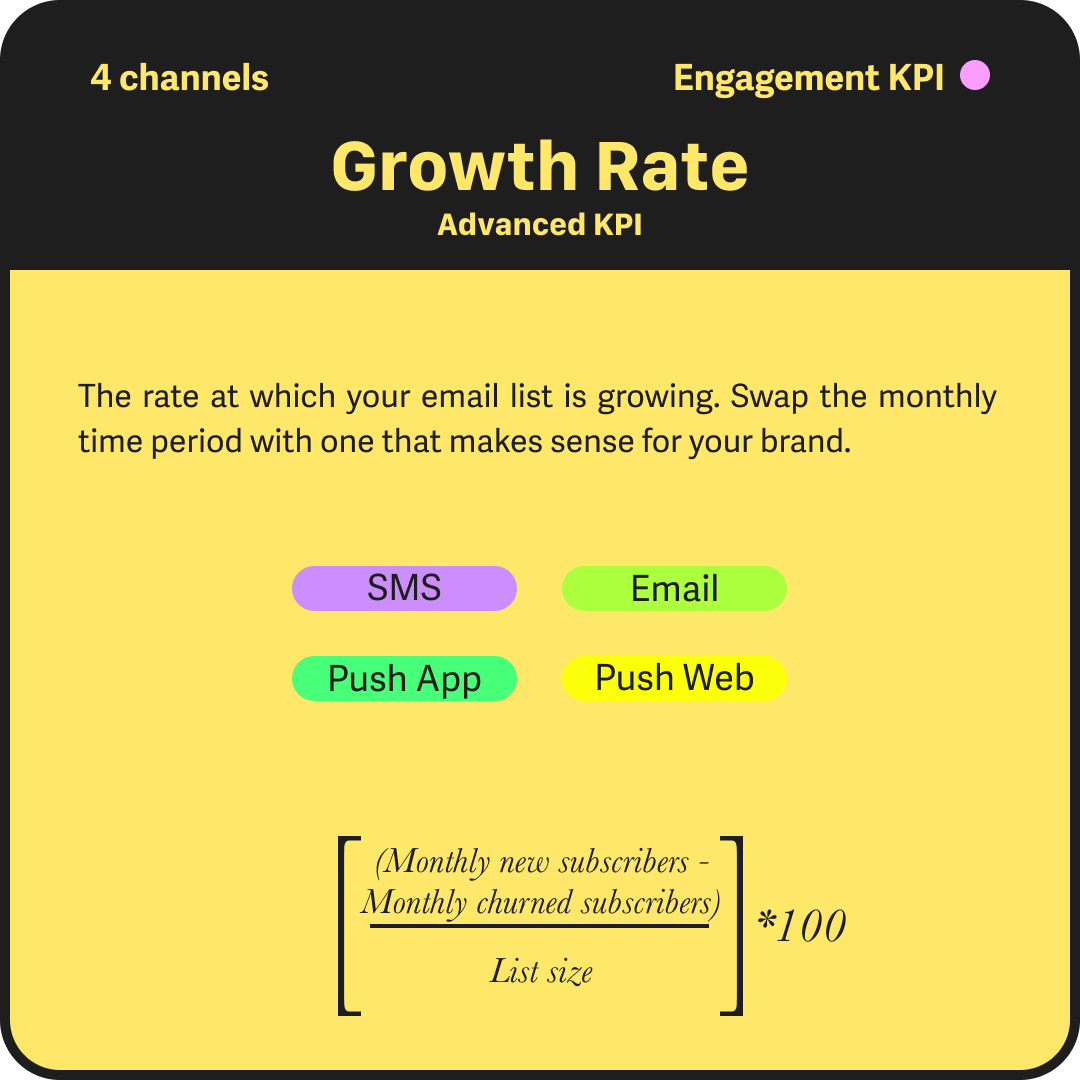
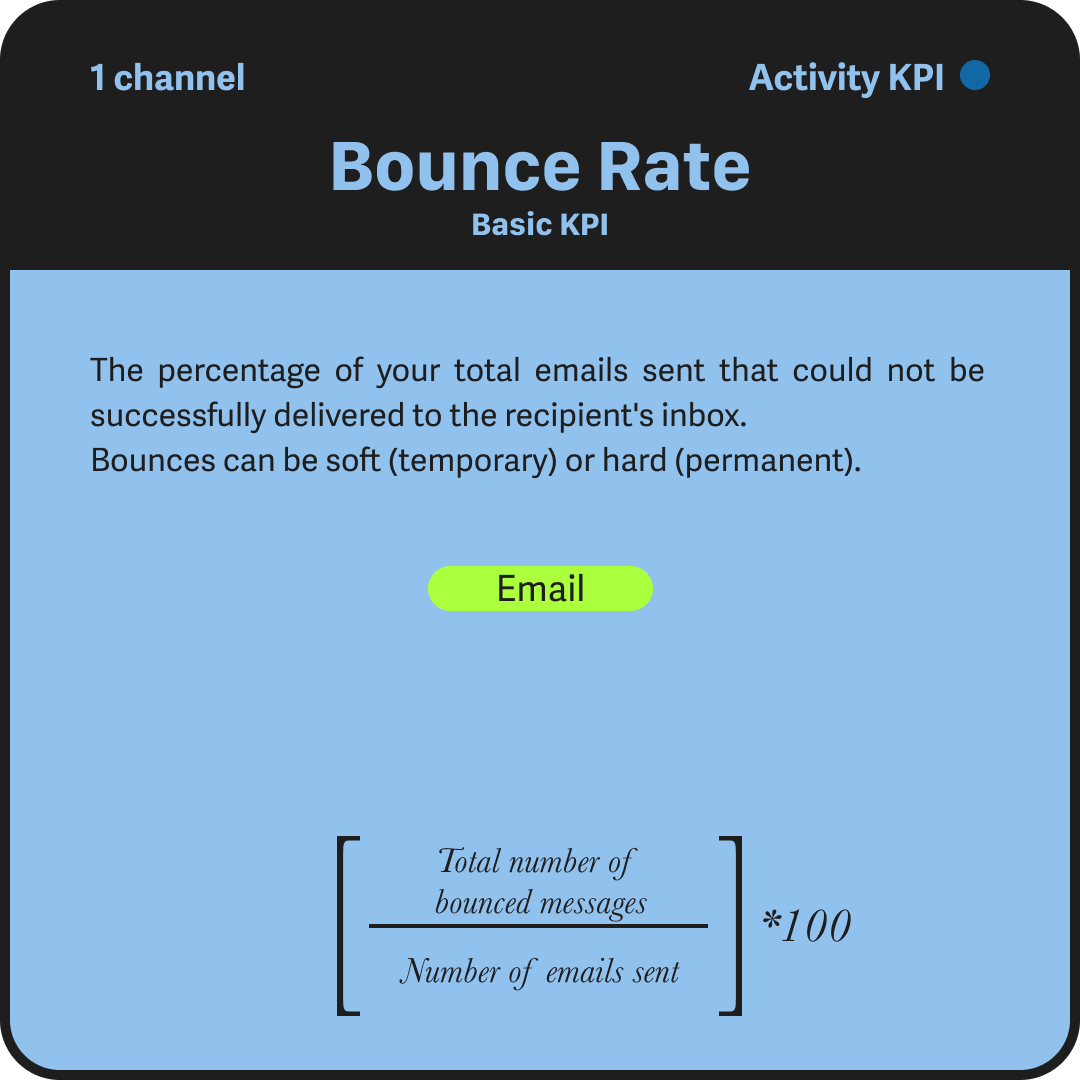
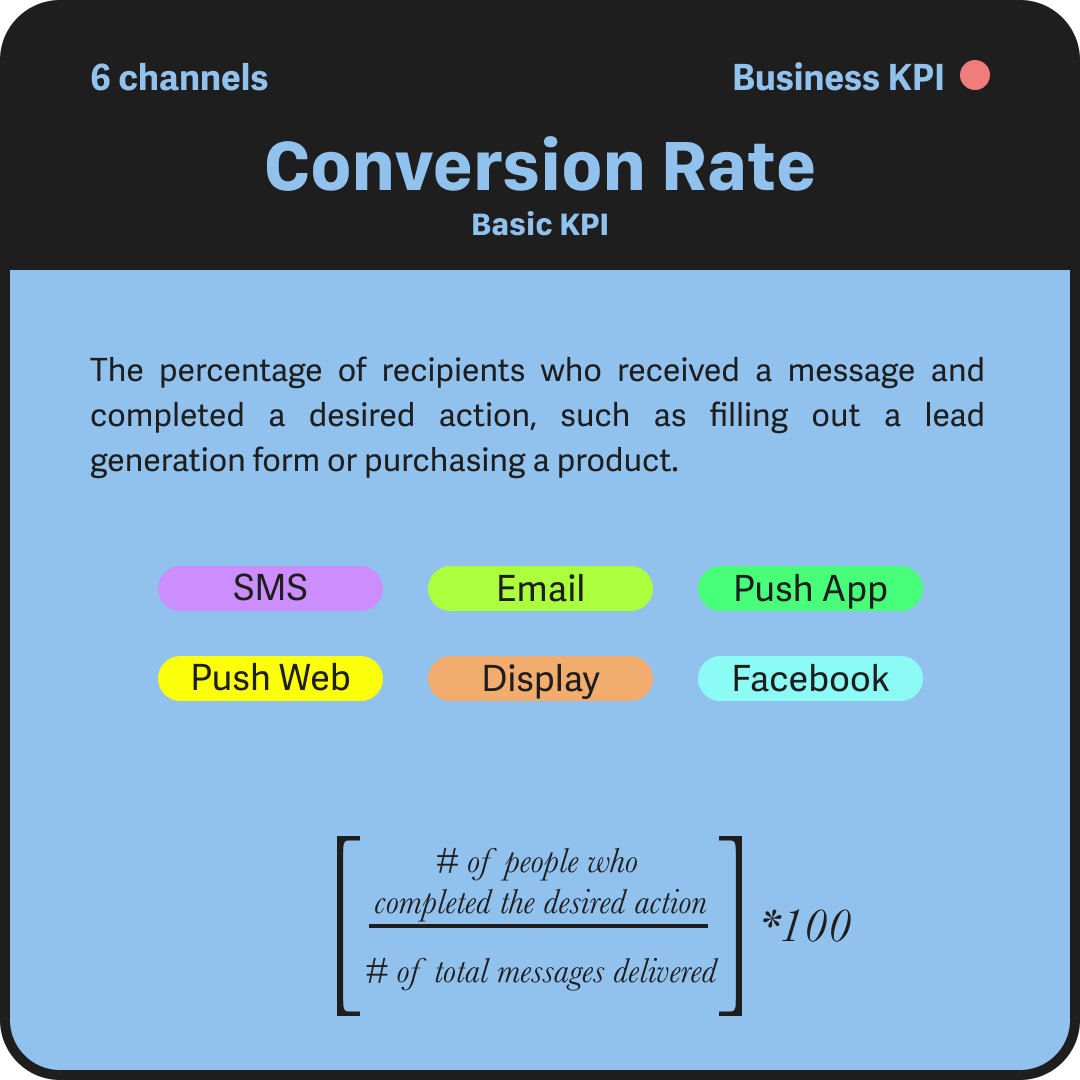
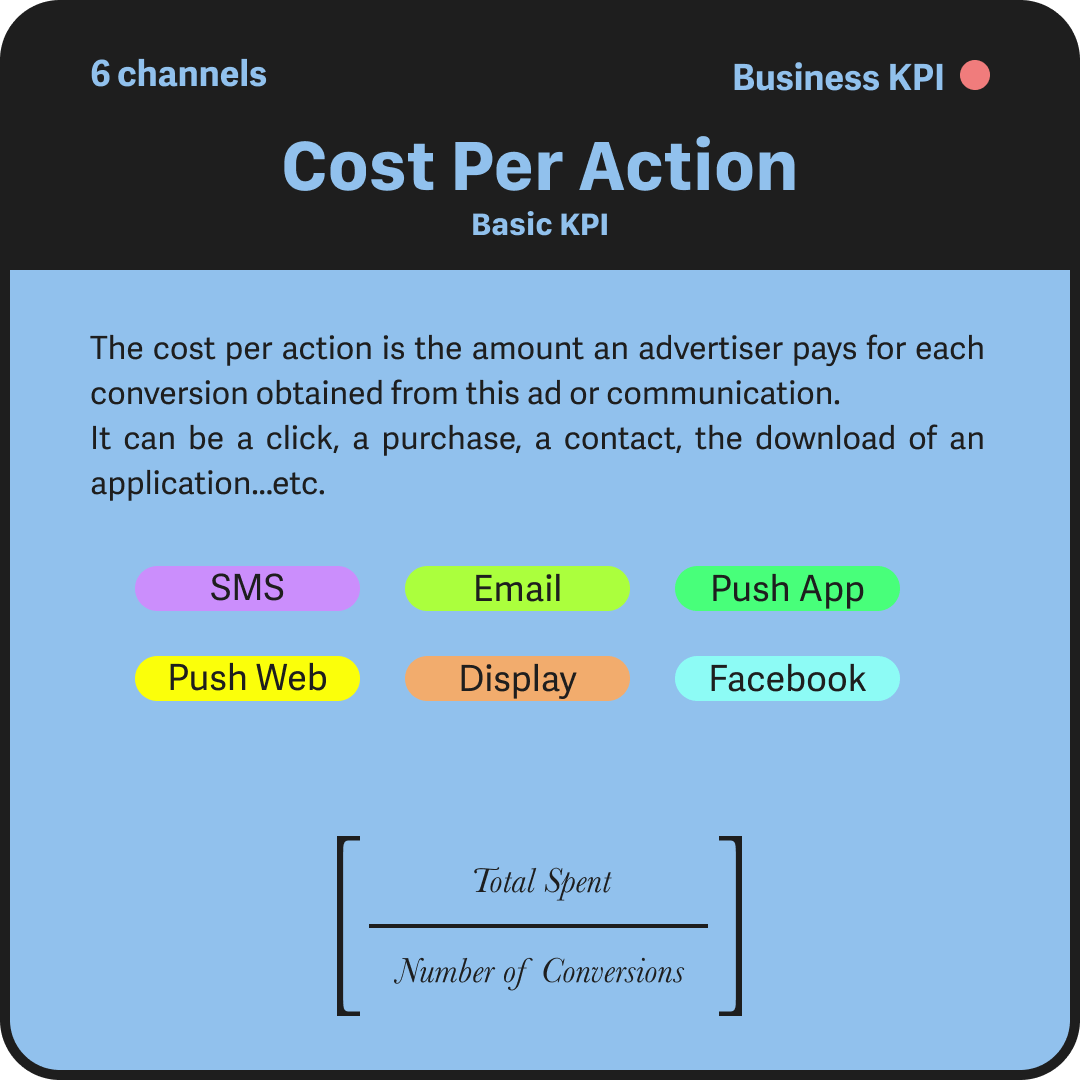
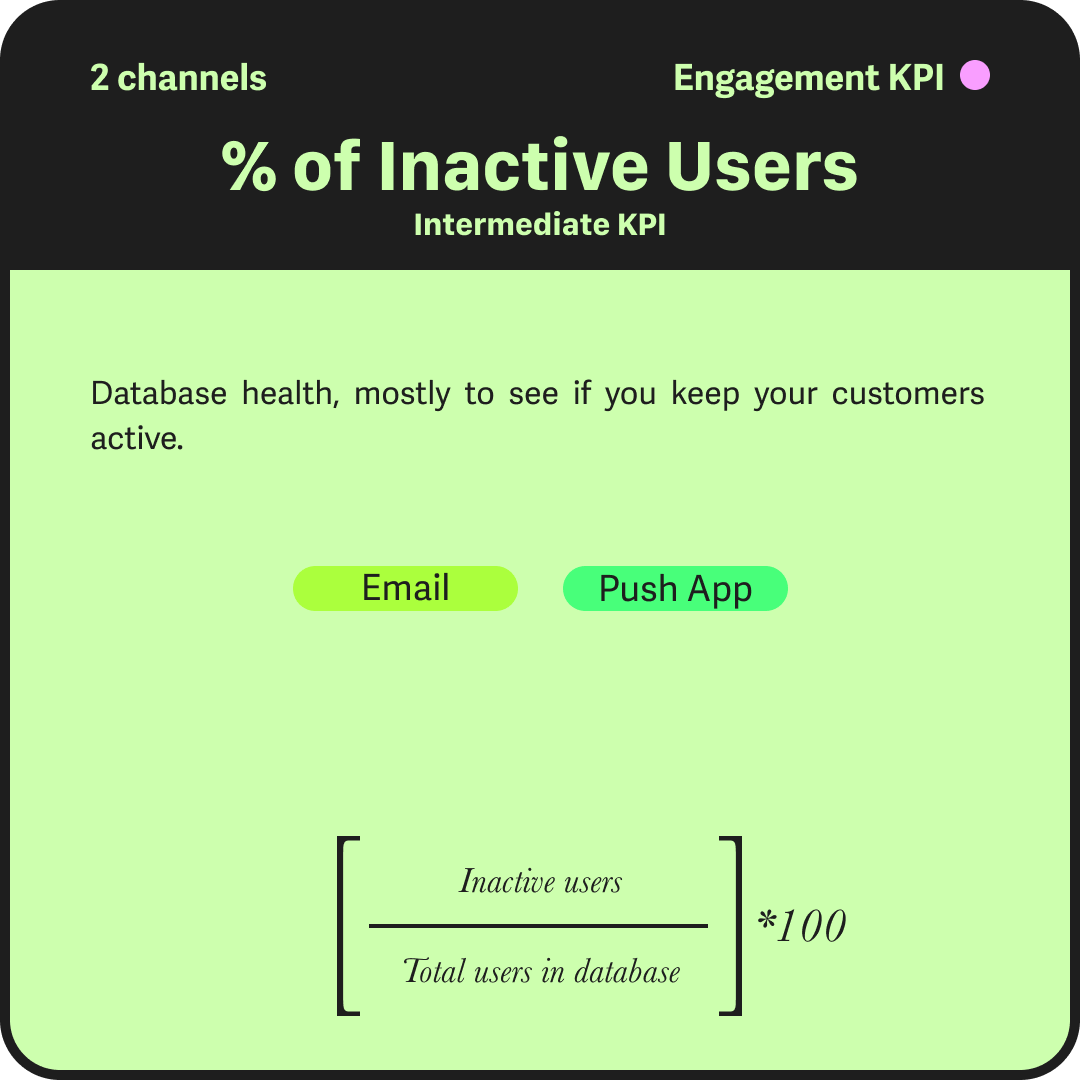
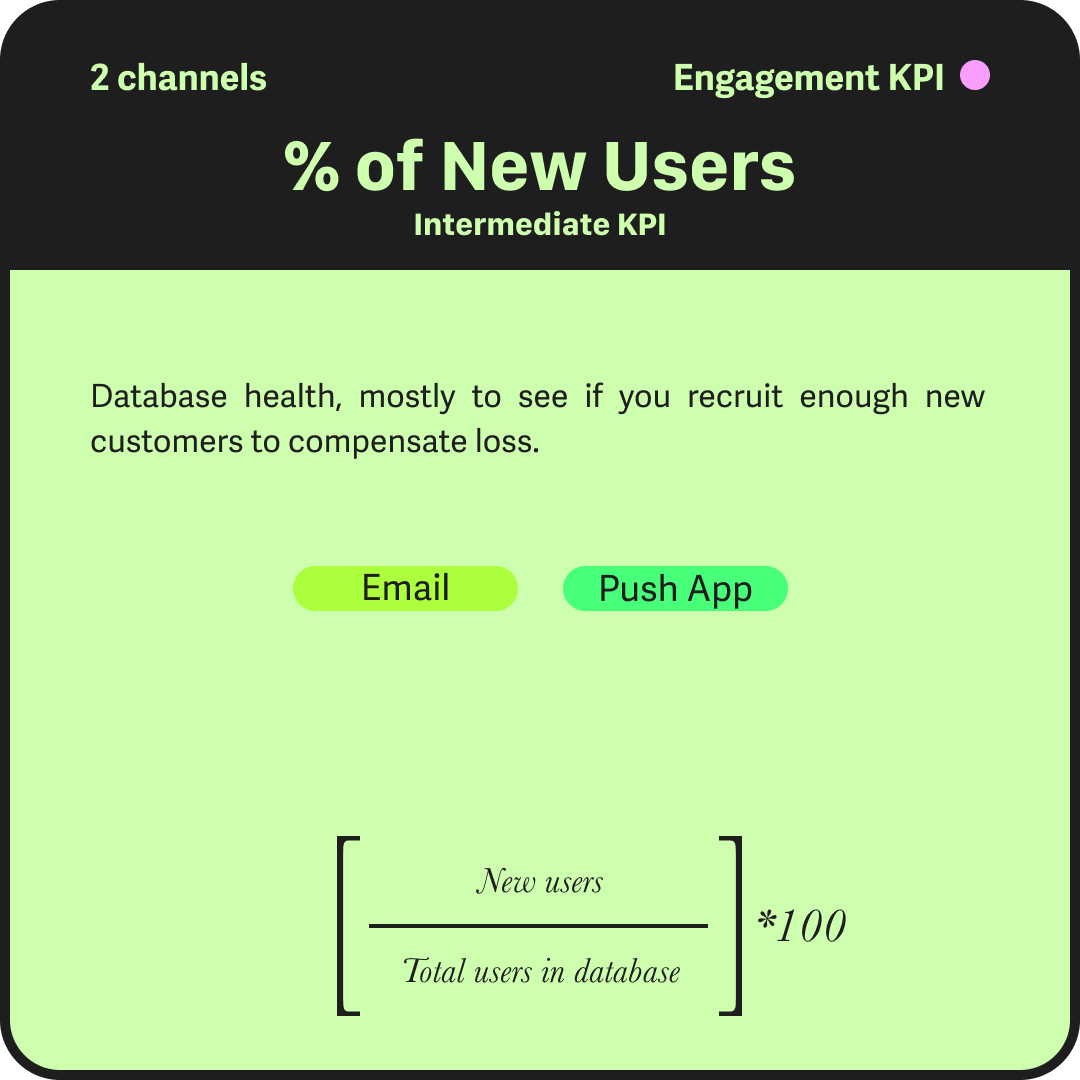
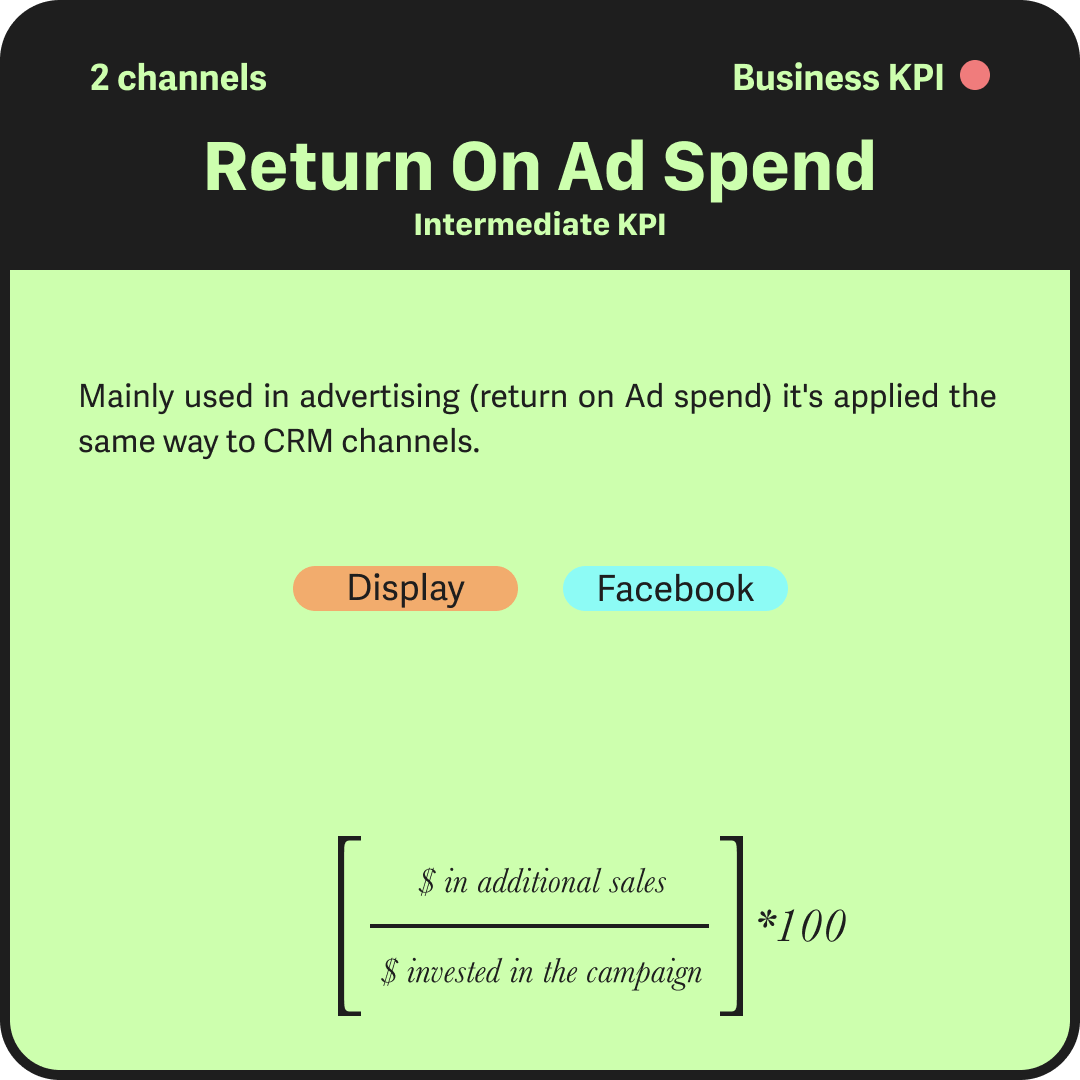
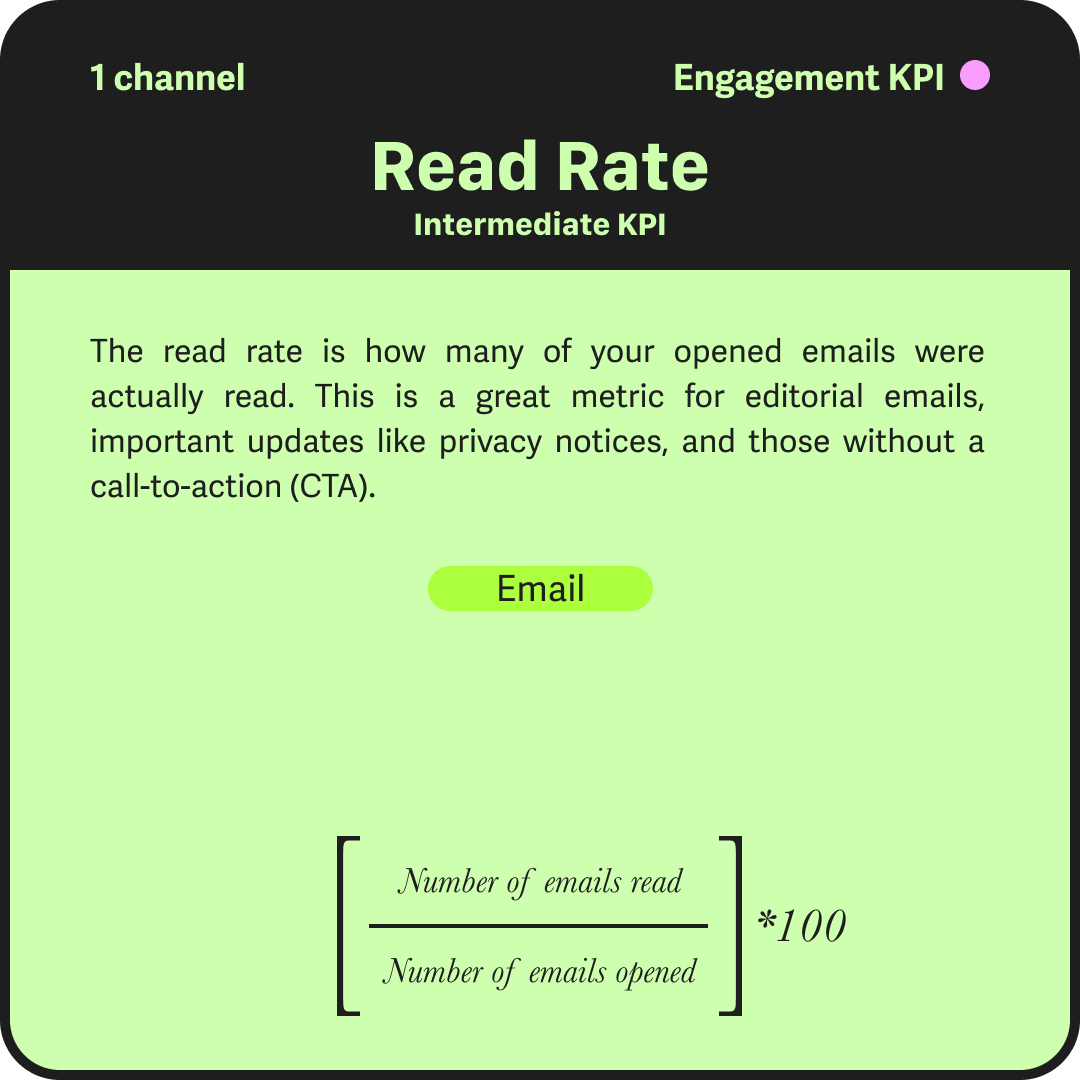
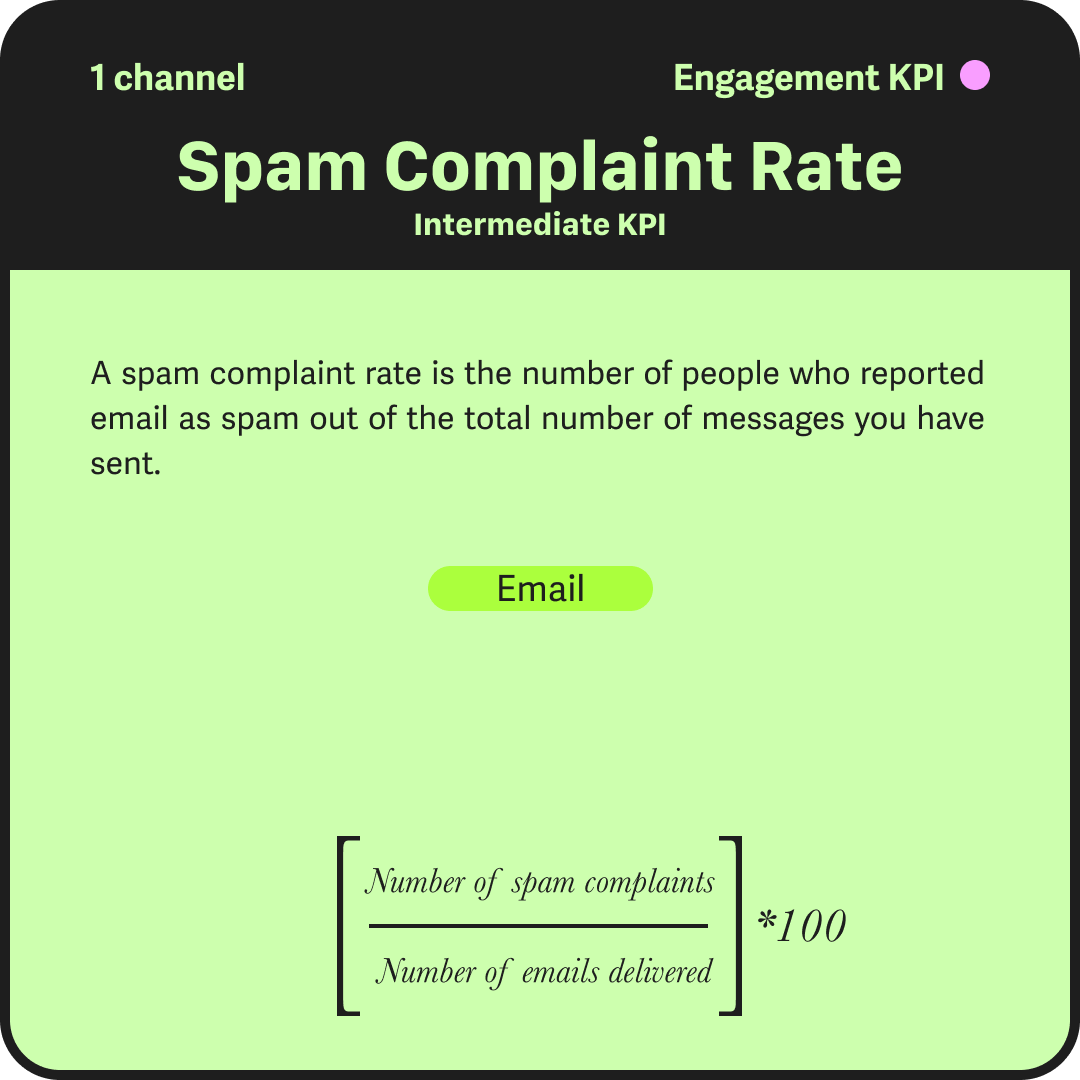
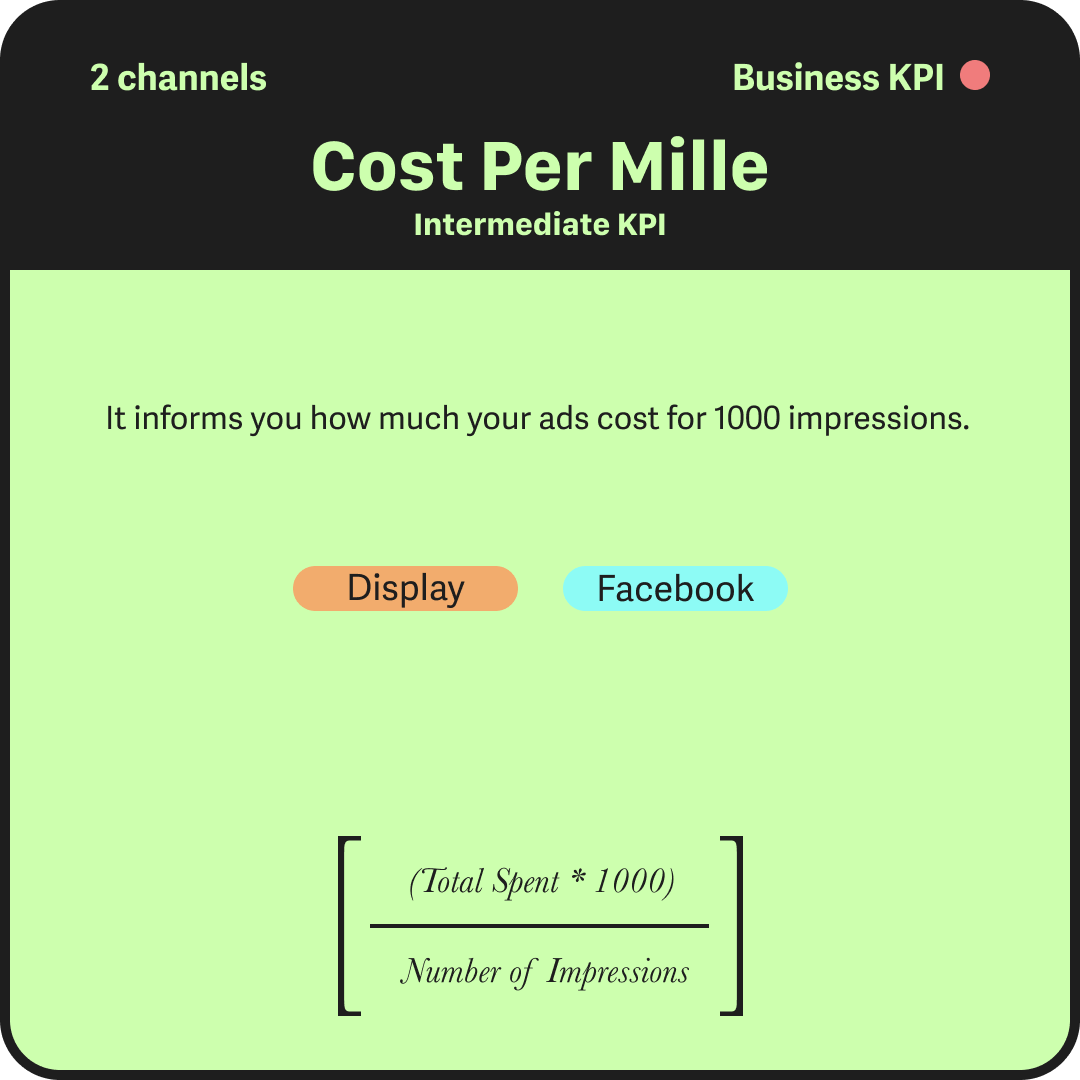
All of the cards within the table are clickable. Clicking on a given card will provide you with more information about the KPI you’re interested in, and, most importantly, the mathematical formula that will allow you to calculate that particular KPI.
The KPIs are sorted into three different categories:
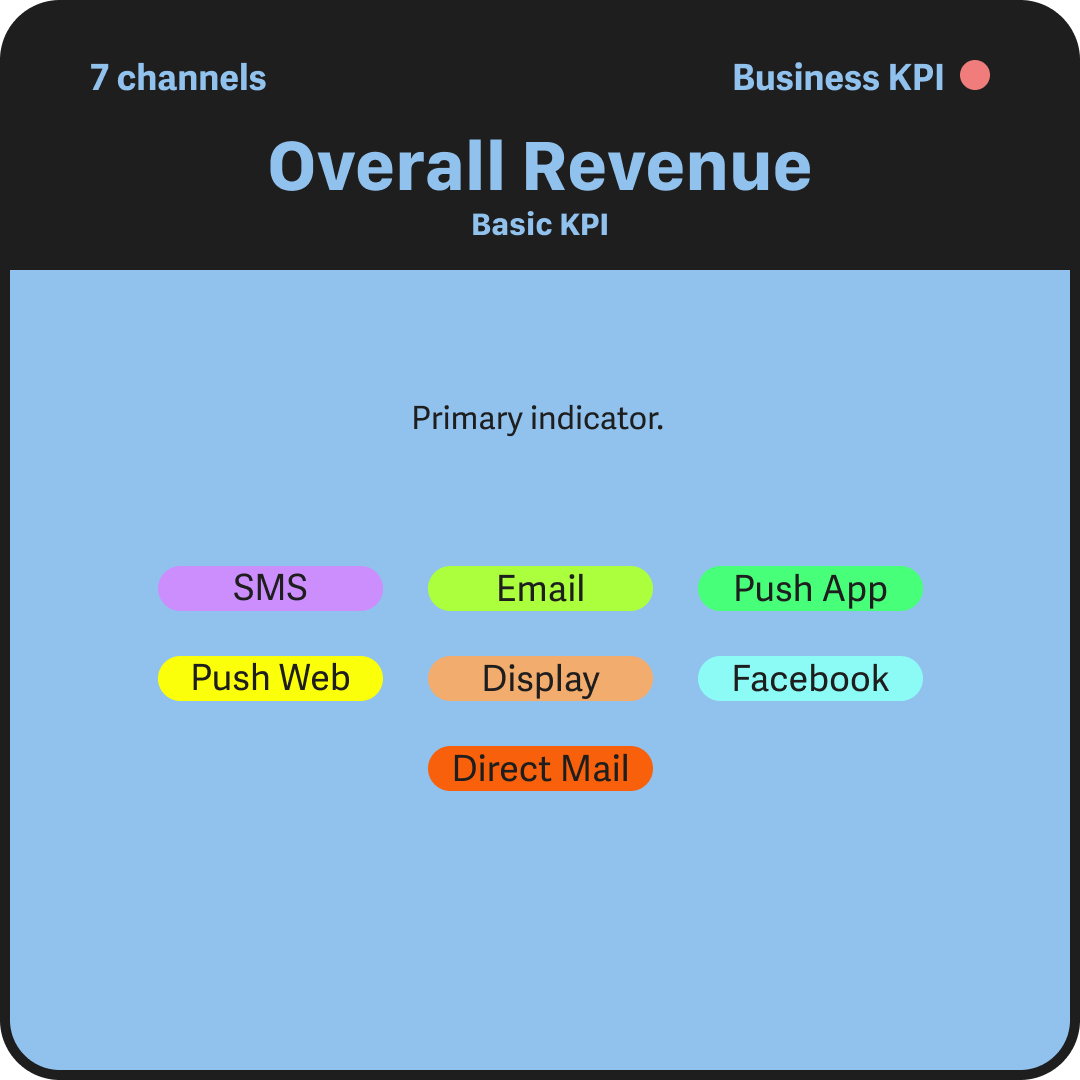
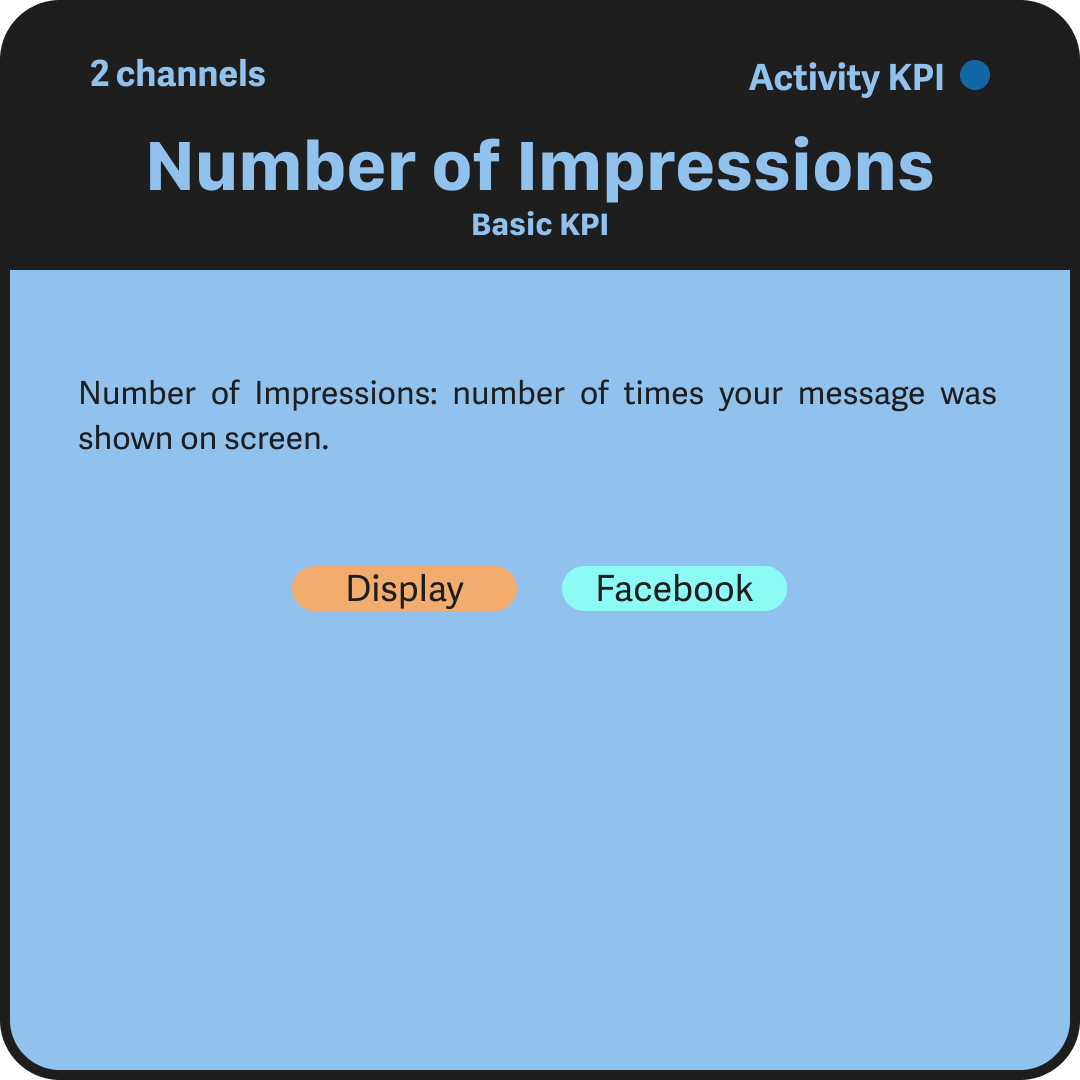
- The Basic KPIs (in blue) are those that you absolutely need to track. You’ll find them in most analytics suites and they’re generally easily understood. Nonetheless, they are a bit limited in scope and will only give you a partial view of the power of your CRM practices.
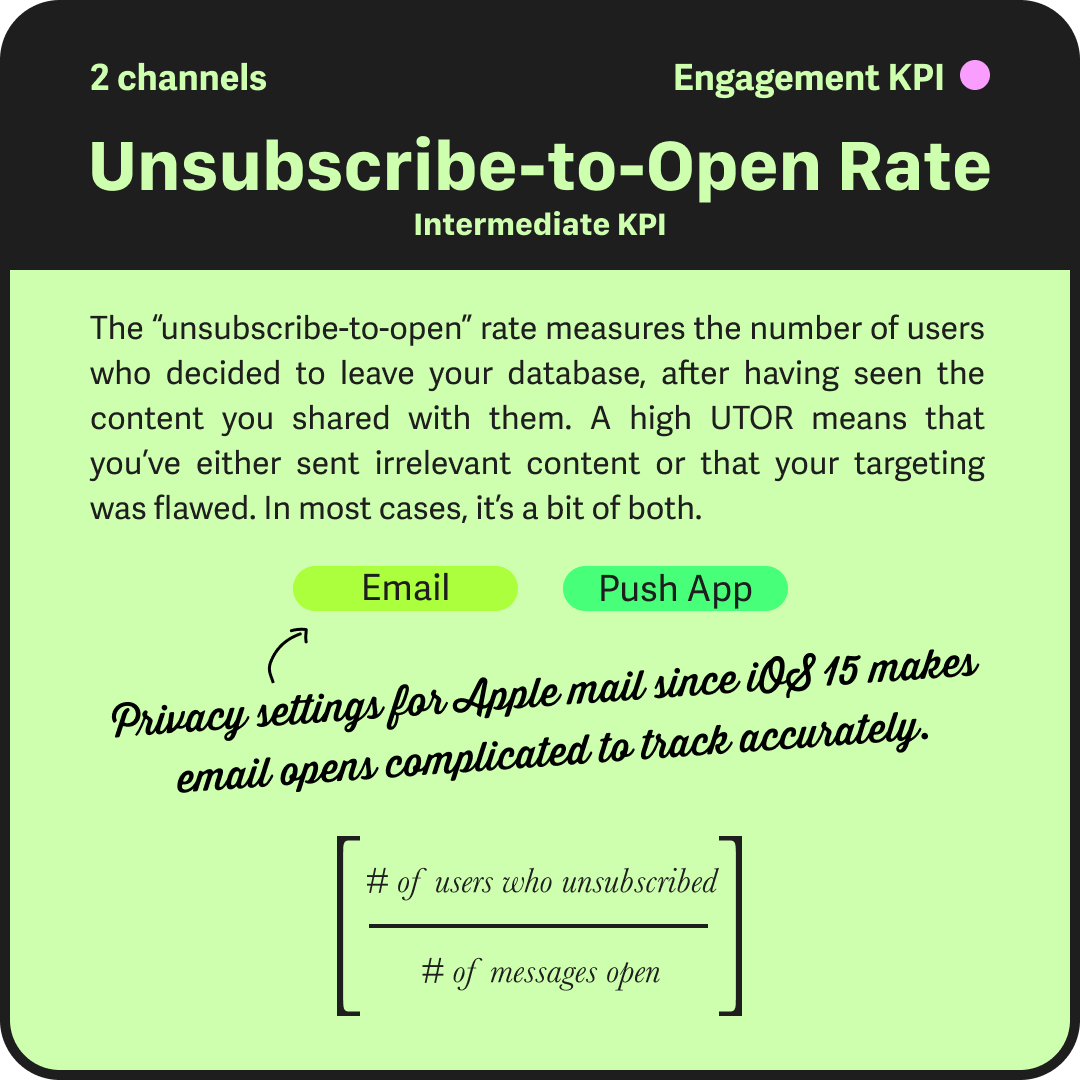
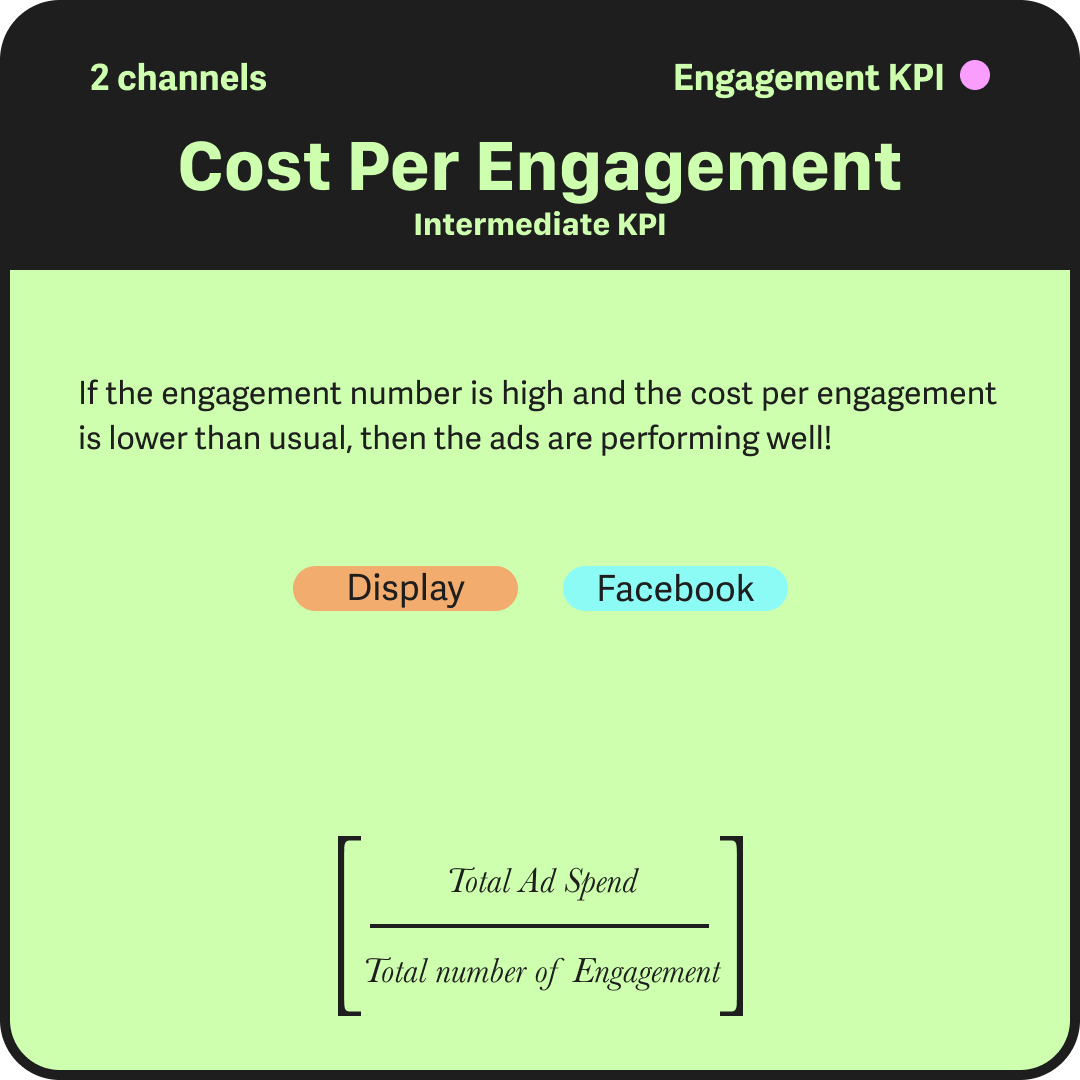
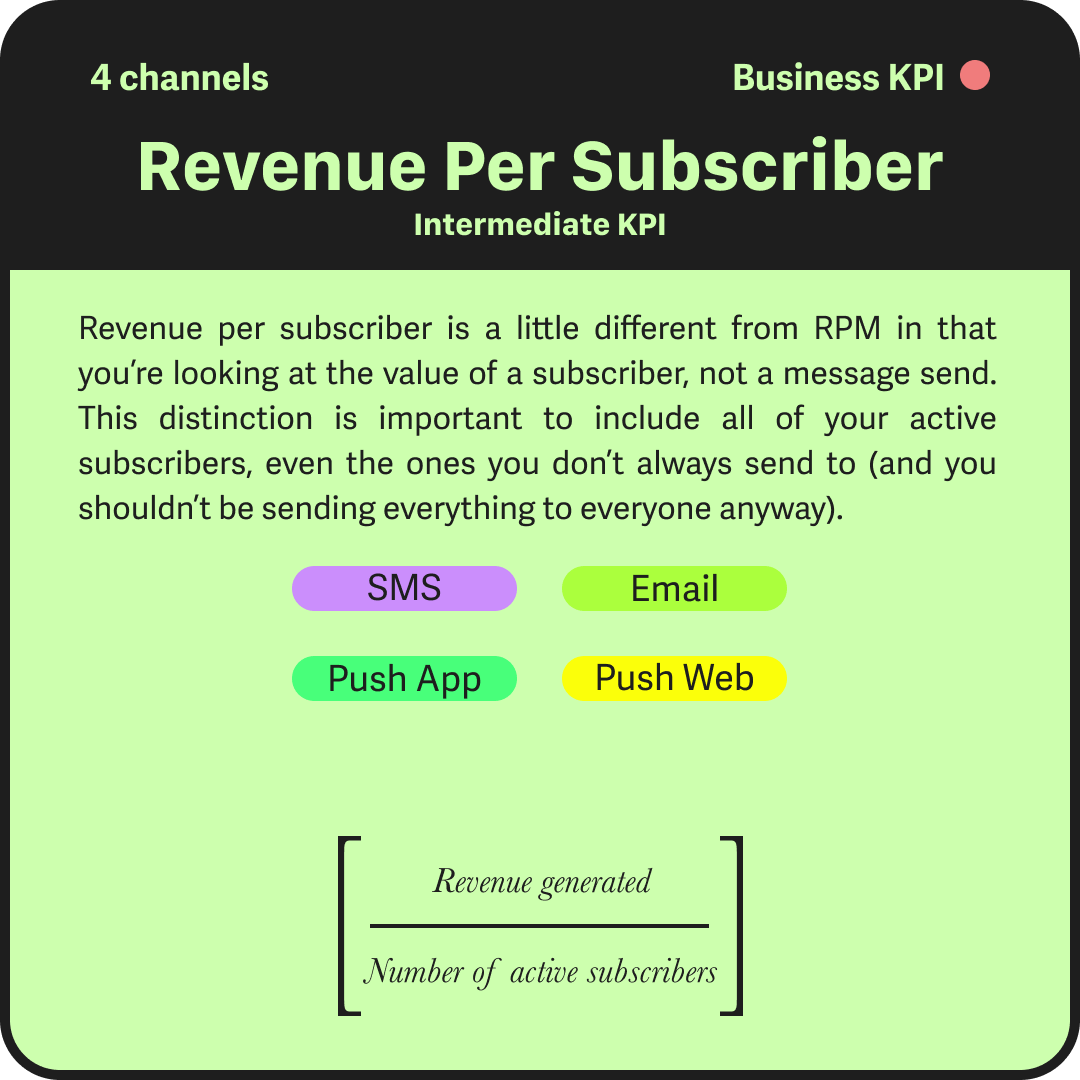
- The Intermediate KPIs (in green) are a little harder to track and are for more developed practices. They’ll require you to make some manual calculations but we can tell you the effort is well worth it. These KPIs offer a lens into the health of your database and the efficiency of your investments.
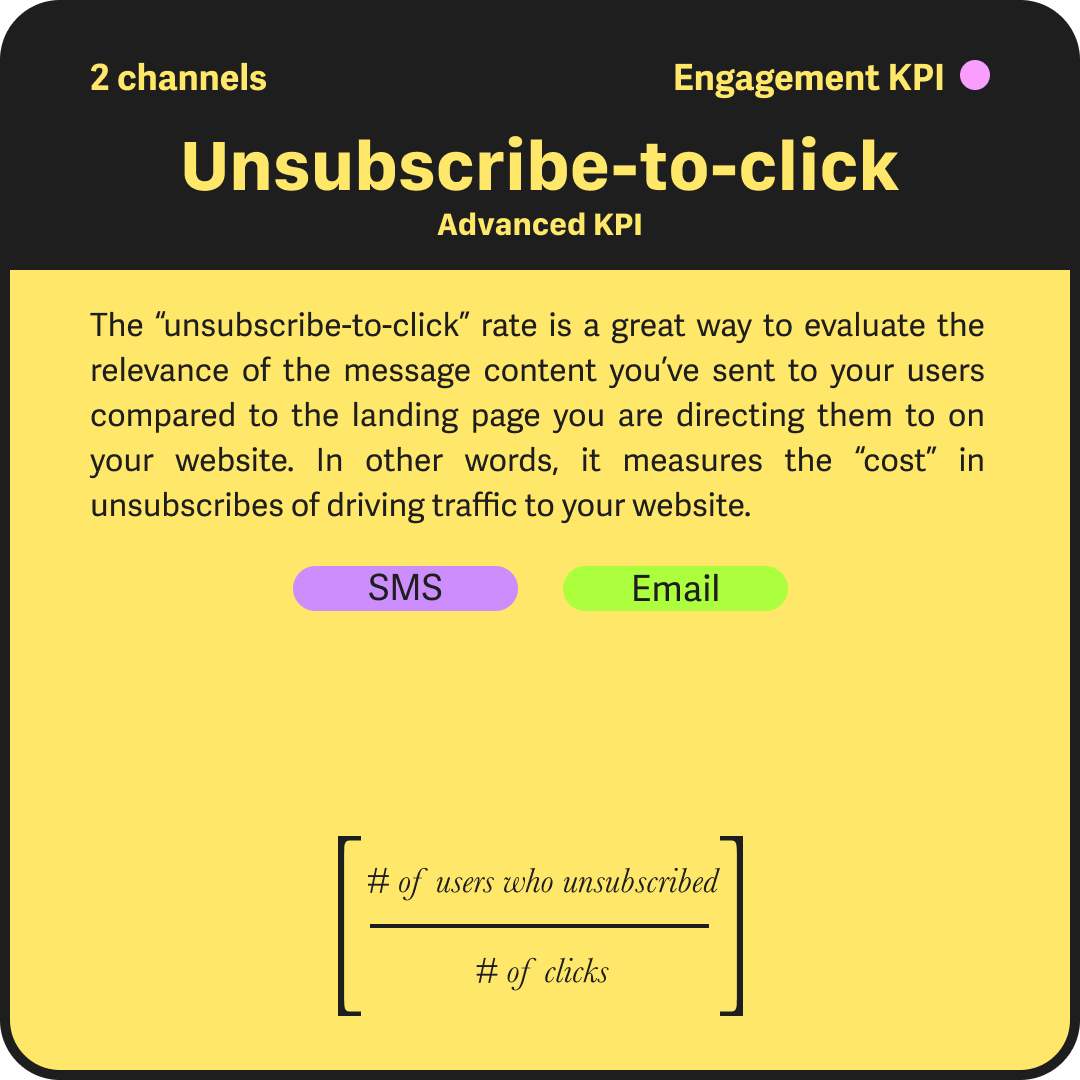
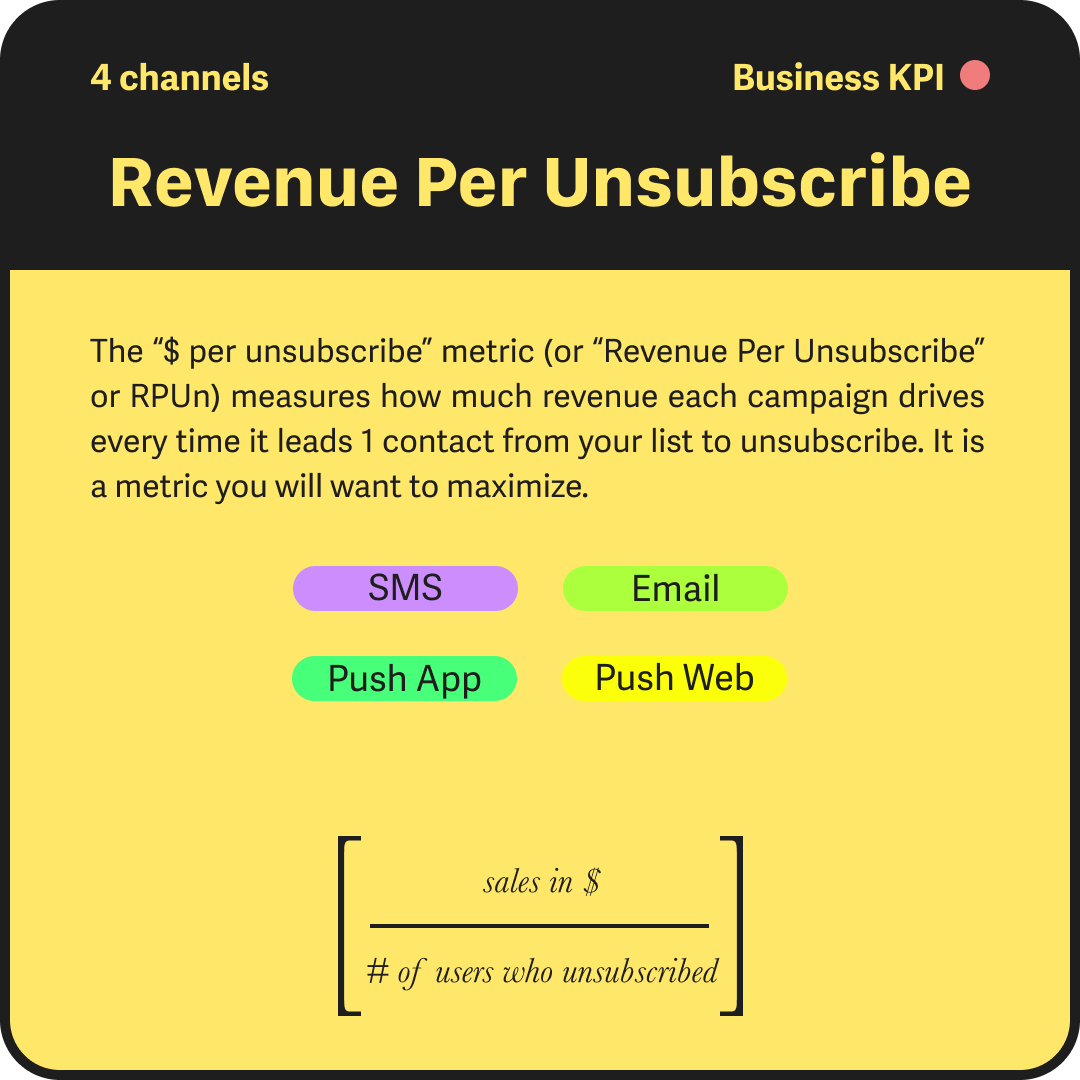
- The Advanced KPIs (in yellow) are for the pros. They require more advanced calculations, on data that are not necessarily easily accessible. We advise you to start with Intermediate KPIs before digging into those ones.
You’ll notice a colored dot at the top right of each card, indicating whether the KPI is an Engagement KPI (Pink), a Business KPI (Red), or an Activity KPI (Blue):
- Engagement KPIs: We’re dealing here with how customers engage with your products or promotions.
- Business KPIs: These KPIs are tied to money, investment, cost. Essentially, they tell you if your advertising money is well spent.
- Activity KPIs: This last category analyzes the interactions of your customer base with your content andthe efficiency of your CRM practices.
Finally, you’ll see a number at the top left of each card corresponding to the number of channels to which each KPI applies.
Let’s look at an example
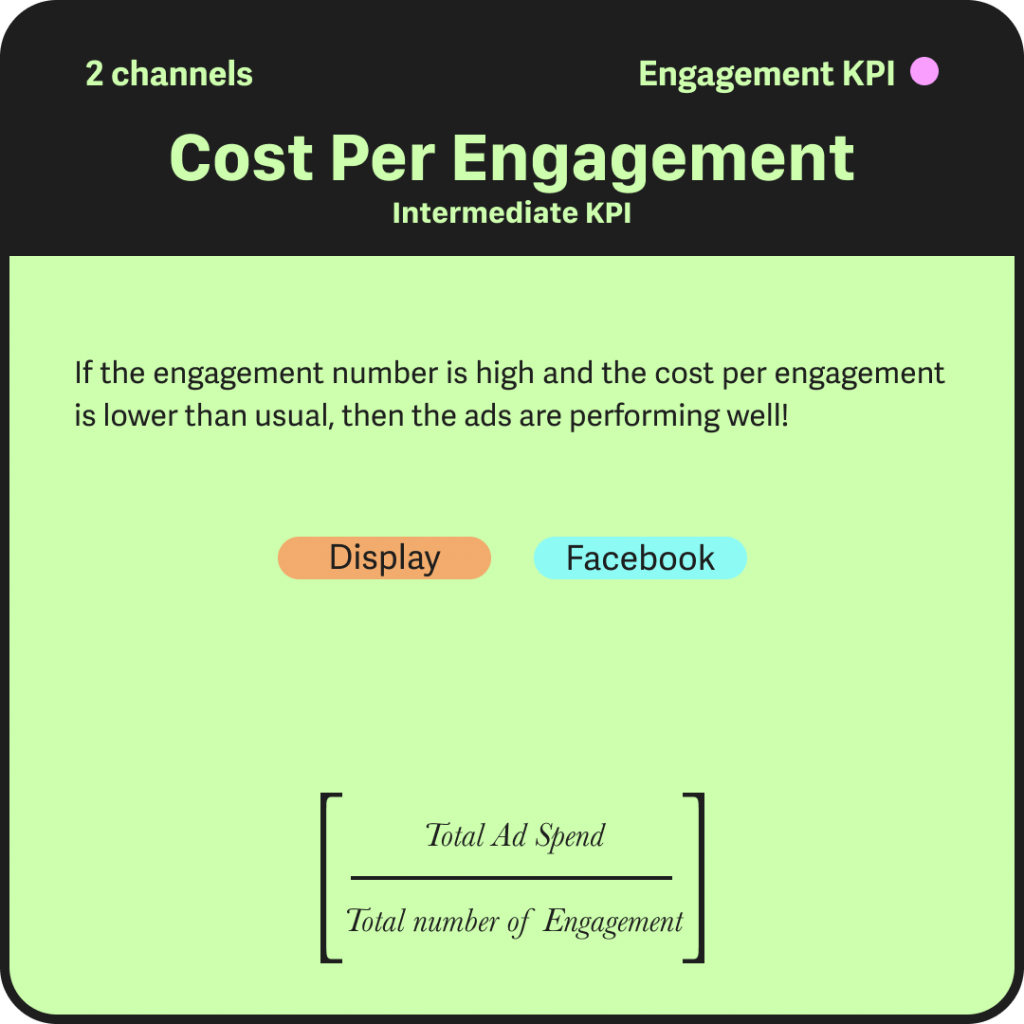
Cost per Engagement is an Intermediate level KPI, so think of its significance in terms of tracking your CRM performance as sort of middle-of-the-road. You can see its definition below the card title, as well as the 2 channels on which it can be applied. You can also see that it is a Business KPI, therefore related to costs and investments. Finally, the formula at the bottom of the card helps you calculate it.
Be sure to bookmark this page so that you can reference it regularly as you build CRM reports and analyze your practices!
We hope that this table is useful – and if you ever want to chat about these KPIs or any other CRM topics you’re interested in, don’t hesitate to reach out to me.
If you’re in a hurry and want to read the table later, or if you want to print it out and start using it in your own KPIs, here’s a link to download the PDF version of the table.
Stay tuned
Subscribe to our newsletter – fresh CRM insights and thought-provoking articles delivered straight to your inbox twice a month. Or, see what it looks like here!
By clicking “Sign Up Now”, you agree to our privacy policy


