How to reach statistical significance with your Control Groups?


Catégorie : Stratégie CRM
Not so long ago, I published an article about Control Groups. I was questioning their relevance, as it seems that they are recommended a little too enthusiastically for any situation. Control groups represent a heavy set up though, and they are in no case the right fit for each situation.
After taking you through what I think are the best conditions to set up a Control Group test, I have regrouped some tips and best practices on how to set up Control Groups, may you wish to set one up nonetheless.
I hinted upon the fact that Control Groups are highly dependent on the volume of data available in order to be statistically significant. But now you might wonder: what is actually statistical significance?
Defining statistical significance, its correlated “p-value”, and ways to improve your results’ significance will not only allow you to improve your results for a better strategy, but also give you a deeper understanding of what it is you are actually doing when analyzing your Control Group results.
Alright, pull up your sleeves and get ready for some mathematical brain twisters.
We’ll touch upon:
First off, let’s clear off any doubts about what is the p-value. It stands for “probability value” and represents the probability of obtaining test results at least as extreme as the results actually observed during a test.
In other words, your test should stand for the breadth of possibilities encountered in extreme real-life scenarios. The p-value ensures this is true.
It is widely used in statistical testing, which is exactly what we are doing here.
Back to Control Groups.
To determine if the results of your test are not due to chance, you will need to determine if you have reached statistical significance. Good news, statistical significance is relying on the p-value.
The lower your p-value, the less likely your results are purely due to chance.
Across all fields of study relying on statistical significance, may it be marketing or biology, results are considered significant if the p-value is lower or equal to 5%. Put it backwards: it means there is a 95% chance that the results you measure are not due to chance.
If you decide to set up a Control Group, and if you reach a p-value below 5, then you can be at least 95% sure that the tested strategy is working.
That’s a pretty high value and you should be confident about what you are planning to implement.
What’s more, you’ll be able to have a pretty reasonable estimate of how much incremental revenue your new strategy will be generating for your business.
That’s a win-win situation.
You understand now the value of statistical significance for your test results.
But how does it work in practice?
Let’s consider together the several steps you need to take to perform a conclusive test.
Your goal will be to evaluate the level of noise on the whole database.
To go a little further, databases show different levels of noise, depending on their size, the industry of the business, the number of buyers, the average basket, etc.
As a result, you need to be able to evaluate what level of noise your database shows, and how to minimize it.To do so, you will have to simulate a large number of random splits of your revenue.
It is as if you would apply random Control Groups to your data.
Doing so, you will be able to compute a significant number of random increments, simulating the cases where your strategy has no effect.
This significant number of random increments will show you the natural dispersion of revenue you can expect in a Control Group analysis.
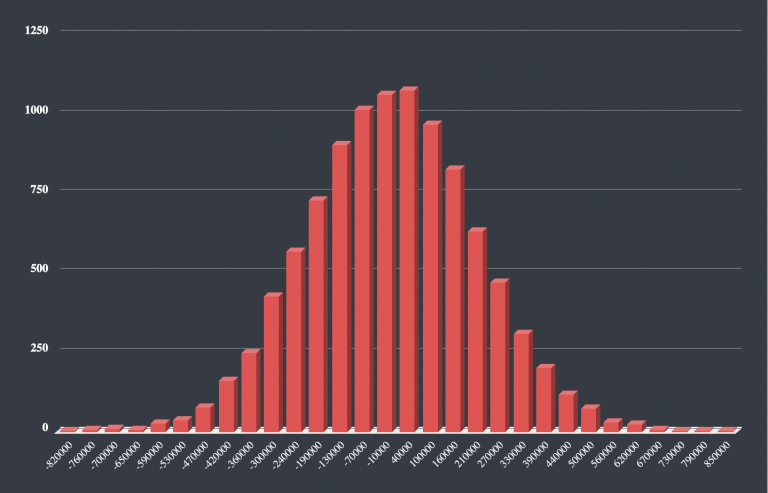
To speak in more concrete terms, your test will generate 10,000 splits and measure each time the difference of revenue between your simulated Test Groups and Control Groups.
You will thus be able to calculate your statistically significant natural volume of increment.
Your results should look like this, where your revenue splits are represented on the X-axis, and your occurrence count on the Y-axis.

Here comes the easy part.
You will need to calculate the real incremental revenue of your strategy, and compare it to the results generated by these random increments.
For instance, if you have opted for a 50 / 50 split of your database, an equal division between your Test Group and your Control Group, you will obtain the following formula: Incremental revenue = Revenue generated by Test Group – Revenue generated by Control Group
By comparing this incremental revenue with your large number of simulated random increments, you can evaluate whether your incremental revenue is significant.
This increment should be higher than at least 95% of the random increments you’ve simulated.
To come back to the chart right above, it means that the bulk of the curve you have generated should be on the left of the incremental revenue you measured in your Control Group test.
Let’s take a concrete example.
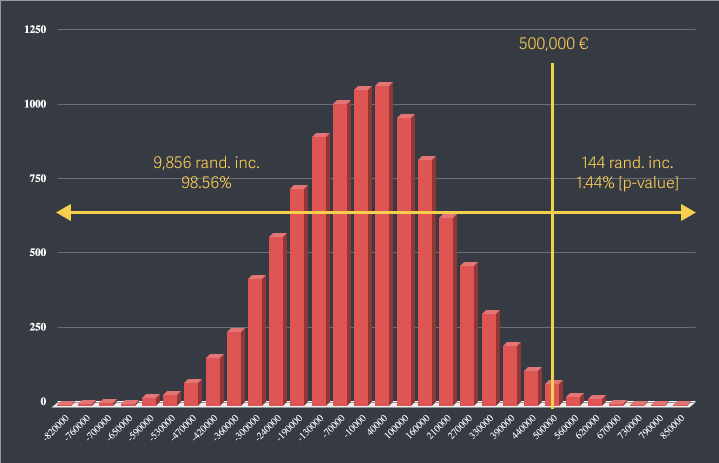
On the graph below, the real incremental revenue measured is 500,000€.
9,856 random increments are lower than 500,000€ (98.56%)
This means that in our example, there is 98.56 % chance that the result is not due to chance, which is above the 95% threshold needed to be considered significant.

In order for your test to be really significant, you will need to reduce the noise as much as possible.
Noise evaluation is central in significance computation.
If you do not take into consideration the noise surrounding your test, you will never be really certain of your results.
There are a few methods to do so and ensure accuracy.
Some of your customers generate so much revenue that having them in the test or the Control Group can significantly skew the results.
As marketers, we usually call them super buyers.
If you remove them from both groups, you will decrease the uncertainty about the results of your test.
The subset you decide to remove should be determined based on your past data, and before the test even begins.
If you run your tests on a previously deployed marketing strategy, your customers might have already been exposed to it.
At this stage, you have two ways to go:
These customers should be taken out of your analysis and it should be reflected in your analysis of the Control Group results.
Don’t be fooled, this will require extra work: you will need to safeguard in parallel the part of your database that should have been exposed to the new strategy.
I’d like to wrap this up after all that we’ve seen on Control Groups together.
A little summary won’t do any harm.
In my previous article, I was advising against the natural tendency to resort to Control Groups to test campaigns of all scale and time spans.
It is ill-advised, as Control Groups require a heavy setup, they require technical and statistical expertise, and they might generate a loss of revenue in the process.
There exists a variety of other tests, way easier to set up, and that could also help you prove your point.
Yet, Control Group testing is a powerful methodology.
It is unequivocally more scientifically robust than attribution methods.
Now you have all the information I think you need to take the correct decisions regarding your needs for a Control Group test.
Up to you to decide now ⚖️
Sommaire